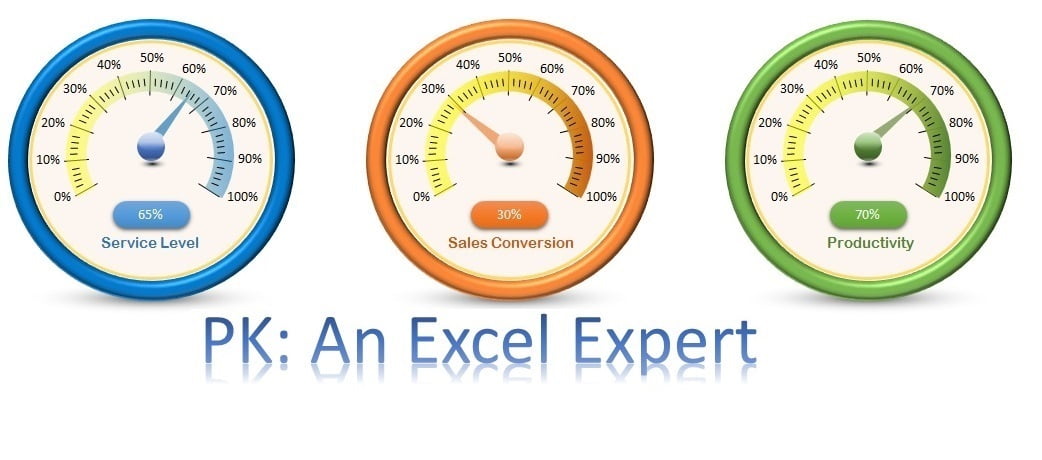
Info-graphics: Animated Hour Glass Chart in Excel
Transform your data visualization with our Animated Hour Glass Chart in Excel, a dynamic and engaging way to represent key performance indicators (KPIs) like Service Level, Quality Score, and Productivity.