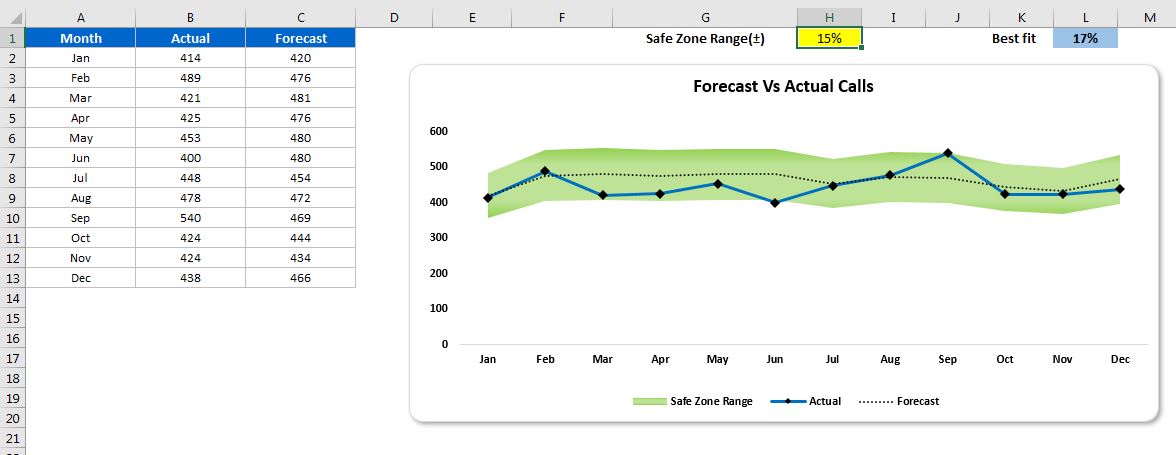
Forecast Vs Actual Chart with Safe Zone Range in Excel
Elevate your financial or operational reporting with our "Forecast Vs Actual Chart with Safe Zone Range" in Excel. This innovative tool is designed to visually compare your forecasted data against