Startups drive innovation, create jobs, and strengthen the global economy. However, startup ecosystems grow successfully only when incubators and accelerators track performance effectively. Many incubators support hundreds of startups every year. They also manage mentorship programs, funding rounds, training sessions, and growth milestones. Therefore, organizations need a structured system to monitor these activities.
Many incubators still rely on manual reports and scattered spreadsheets. As a result, decision-makers struggle to measure startup progress, mentorship effectiveness, and program outcomes. Because of this challenge, incubators increasingly adopt data-driven KPI dashboards.
Click to Purchases Incubators and Accelerators KPI Dashboard in Power BI
One of the most effective solutions is the Incubators and Accelerators KPI Dashboard in Power BI. This ready-to-use dashboard helps startup support organizations monitor key performance indicators in a centralized environment. Moreover, it converts complex performance data into easy-to-understand charts, KPIs, and trend analysis.
In this article, you will learn everything about the Incubators and Accelerators KPI Dashboard in Power BI, including its features, structure, advantages, best practices, and frequently asked questions.
What Is an Incubators and Accelerators KPI Dashboard in Power BI?
An Incubators and Accelerators KPI Dashboard in Power BI is an interactive business intelligence tool that tracks and analyzes startup ecosystem performance. It allows incubators, accelerators, venture programs, and innovation hubs to monitor program outcomes using measurable indicators.
Because startup programs involve many variables, organizations must track several KPIs, such as:
-
Number of startups incubated
-
Funding raised by startups
-
Startup survival rate
-
Mentor engagement
-
Program completion rate
-
Startup revenue growth
-
Investment readiness score
Therefore, this dashboard brings all those indicators together in one analytical platform.
Moreover, Power BI transforms raw Excel data into dynamic charts, KPI cards, and comparison indicators. Consequently, program managers and decision-makers gain immediate insights into startup performance and program effectiveness.
Why Do Incubators and Accelerators Need KPI Dashboards?
Startup programs operate in fast-changing environments. Every month new startups join programs while others graduate or raise funding. Because of this dynamic environment, organizations must monitor performance continuously.
Without a dashboard, teams often face several challenges:
-
Difficulty tracking startup progress
-
Time-consuming manual reporting
-
Inconsistent performance measurements
-
Lack of historical comparisons
-
Slow decision-making
However, when organizations implement a KPI dashboard, they gain real-time insights. As a result, leaders identify trends faster and improve program strategies.
Furthermore, dashboards allow incubators to demonstrate their impact to stakeholders such as:
-
Government agencies
-
Venture capital firms
-
Corporate innovation partners
-
Universities
-
Investors
Therefore, a KPI dashboard becomes an essential management and reporting tool.
Click to Purchases Incubators and Accelerators KPI Dashboard in Power BI
Key Features of the Incubators and Accelerators KPI Dashboard in Power BI
This dashboard offers a structured approach to monitoring incubator performance. It uses Power BI visualization features combined with Excel data sources.
Below are the major features of this dashboard.
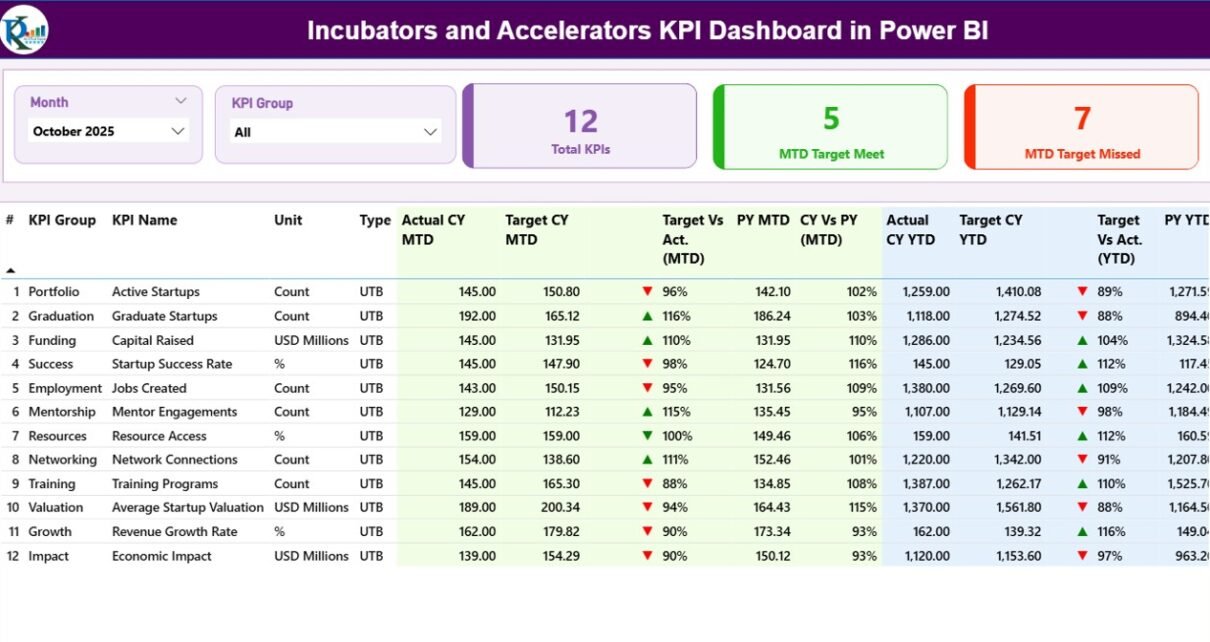
How Does the Summary Page Provide a Complete KPI Overview?
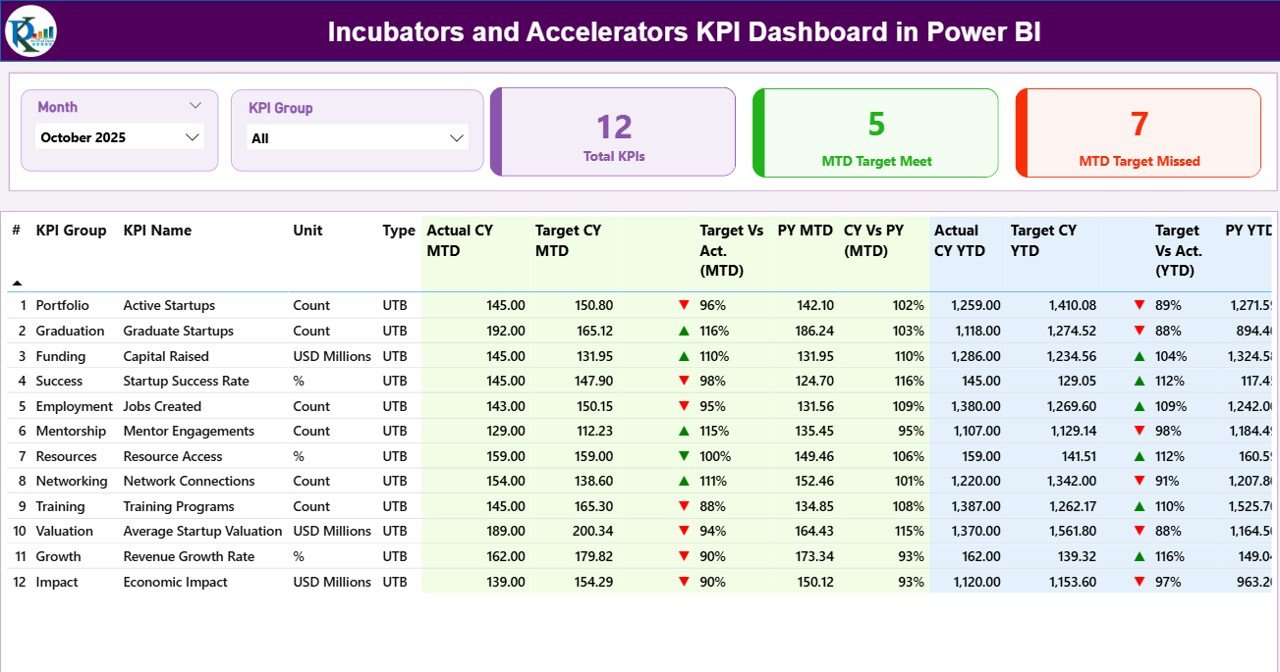
The Summary Page acts as the main dashboard page. It displays overall KPI performance for incubators and accelerators.
At the top of the page, users see two interactive slicers:
-
Month Slicer – allows users to filter performance by month
-
KPI Group Slicer – enables filtering by KPI category
These slicers allow users to analyze program performance from different perspectives.
KPI Cards for Quick Performance Monitoring
The dashboard also includes three KPI cards that highlight important metrics:
-
Total KPIs Count – shows the number of KPIs tracked in the system
-
MTD Target Meet Count – indicates how many KPIs achieved their targets
-
MTD Target Missed Count – highlights KPIs that failed to meet targets
These cards provide a quick snapshot of overall program performance.
Detailed KPI Table
Below the KPI cards, the dashboard presents a detailed KPI table. This table displays all KPI information in a structured format.
The table includes the following columns:
KPI Number
This column displays the sequence number of each KPI. It helps users organize performance metrics.
KPI Group
This column identifies the category of the KPI. For example, the KPI group may represent:
-
Startup Growth
-
Funding Performance
-
Program Engagement
-
Mentor Effectiveness
KPI Name
This column displays the name of the KPI.
Examples include:
-
Total Startups Incubated
-
Funding Raised by Startups
-
Mentorship Sessions Conducted
-
Startup Graduation Rate
Unit
This column indicates the measurement unit of the KPI.
Units may include:
-
Number
-
Percentage
-
USD
-
Hours
KPI Type
Click to Purchases Incubators and Accelerators KPI Dashboard in Power BI
The dashboard supports two types of KPIs:
-
UTB (Upper the Better) – Higher values indicate better performance
-
LTB (Lower the Better) – Lower values indicate better performance
For example:
-
Startup funding raised → UTB
-
Startup failure rate → LTB
Actual CY MTD
This value represents the Actual Current Year Month-To-Date performance of the KPI.
Target CY MTD
This value represents the target value for the current year MTD.
MTD Icon Indicator
The dashboard visually indicates KPI performance using icons.
-
▲ Green arrow → KPI meets or exceeds target
-
▼ Red arrow → KPI falls below target
Because visual indicators highlight performance instantly, managers identify issues quickly.
Target vs Actual (MTD)
This column calculates the performance ratio between actual and target values.
Formula:
Actual MTD / Target MTD
Therefore, users easily measure how close the program comes to achieving goals.
Previous Year MTD
This column shows the KPI value for the same period in the previous year.
Current Year vs Previous Year (MTD)
This metric compares current performance with historical performance.
Formula:
Current Year MTD / Previous Year MTD
Because this comparison highlights trends, decision-makers evaluate growth or decline effectively.
Actual CY YTD
This metric displays Actual Year-To-Date performance.
Target CY YTD
This metric shows target YTD performance.
YTD Icon Indicator
Similar to the MTD indicator, this icon highlights YTD performance:
-
▲ Green arrow → Target achieved
-
▼ Red arrow → Target missed
Target vs Actual (YTD)
Formula:
Actual YTD / Target YTD
This value helps organizations measure long-term KPI performance.
Previous Year YTD
This value represents historical YTD data.
Current Year vs Previous Year (YTD)
Formula:
Current YTD / Previous Year YTD
Therefore, incubators can easily analyze growth trends.
Click to Purchases Incubators and Accelerators KPI Dashboard in Power BI
How Does the KPI Trend Page Help Analyze Performance?
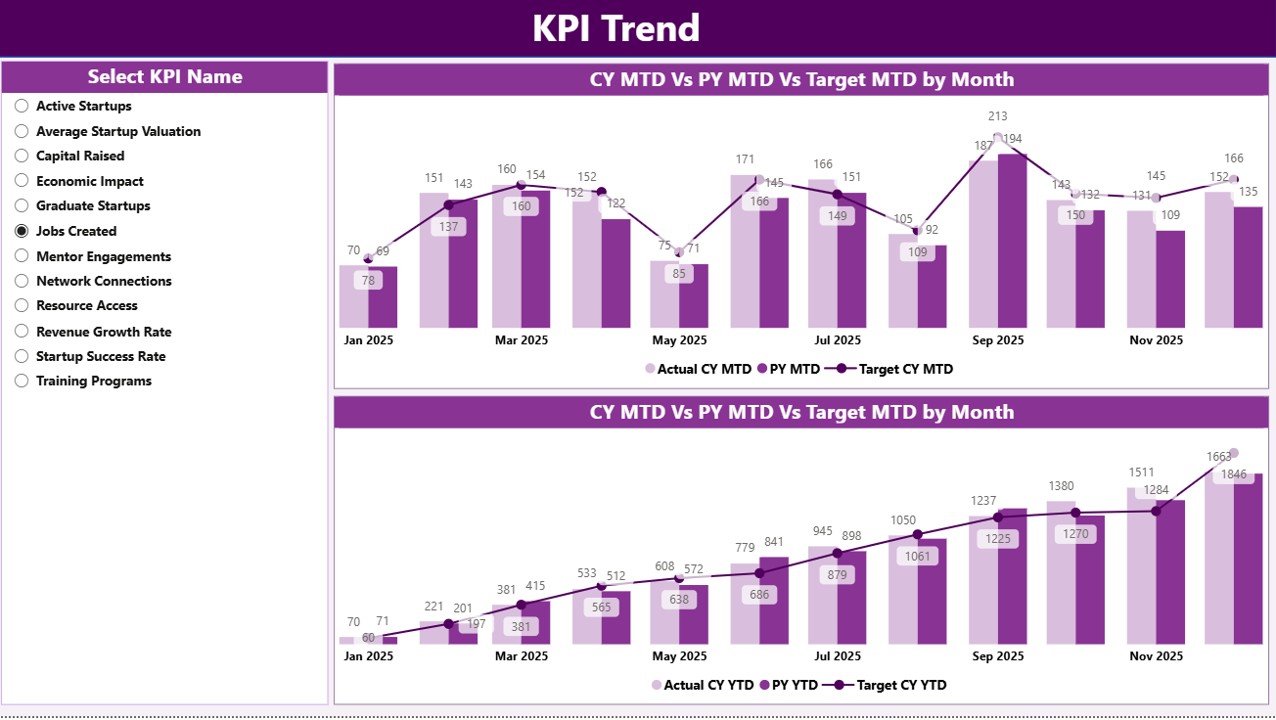
The KPI Trend Page provides deeper insights into KPI movement over time.
This page includes:
-
Two combo charts
-
A KPI slicer
KPI Selection Slicer
Users can select a specific KPI using the slicer. Once selected, the charts update automatically.
Therefore, users analyze individual KPI performance.
MTD Trend Chart
This chart compares:
-
Current Year Actual
-
Previous Year Actual
-
Target values
Because the chart combines multiple metrics, users identify performance gaps quickly.
YTD Trend Chart
The YTD trend chart shows long-term KPI performance.
It compares:
-
Current year YTD
-
Previous year YTD
-
Target YTD
Consequently, program managers understand whether the incubator improves over time.
What Is the Purpose of the KPI Definition Page?
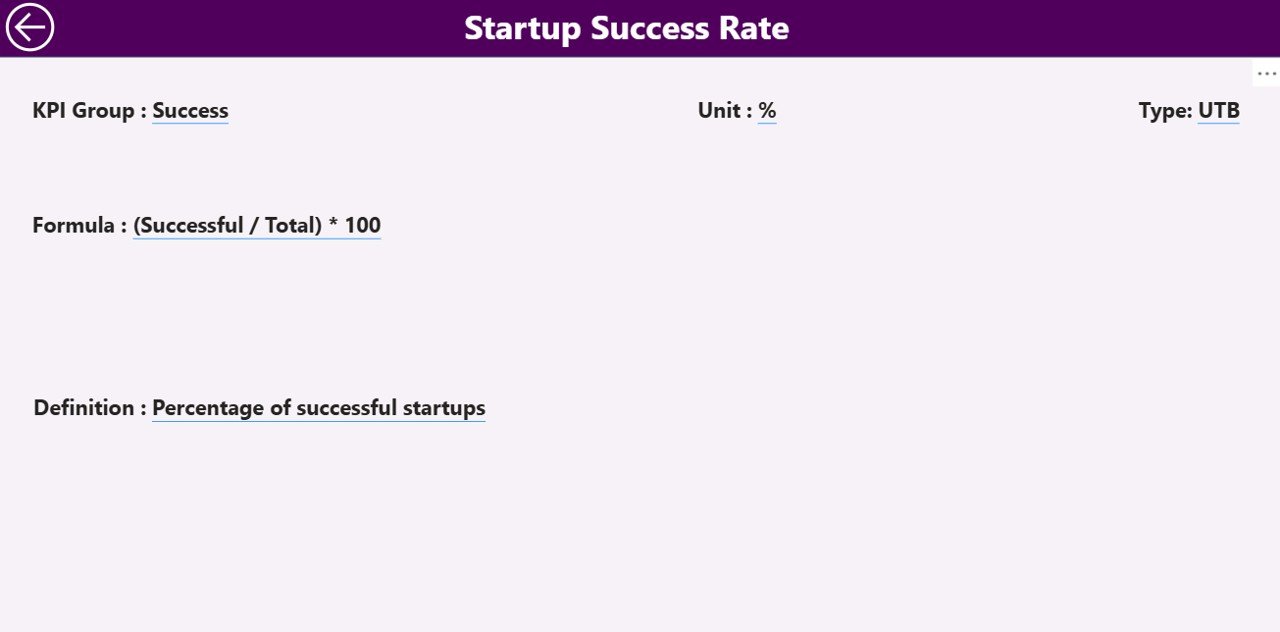
The KPI Definition Page acts as a detailed reference page.
It contains:
-
KPI formula
-
KPI description
-
Measurement units
-
KPI type
Moreover, this page uses drill-through functionality.
Users can right-click a KPI in the summary page and view its definition instantly.
This feature ensures that users understand KPI calculations clearly.
To return to the main page, users simply click the Back Button located at the top left corner.
How Does the Excel Data Source Work?
This Power BI dashboard uses Excel as the data source. Therefore, organizations can update data easily without technical expertise.
The Excel file contains three worksheets.
Input_Actual Worksheet
This sheet stores the actual KPI performance values.
Users must enter the following fields:
-
KPI Name
-
Month (first date of the month)
-
MTD value
-
YTD value
Once users update the sheet, Power BI automatically refreshes the dashboard.
Input_Target Worksheet
This sheet stores the target values for each KPI.
Required columns include:
-
KPI Name
-
Month
-
Target MTD
-
Target YTD
Therefore, users can compare actual performance with targets.
KPI Definition Worksheet
This sheet contains the metadata for KPIs.
Users must fill the following fields:
-
KPI Number
-
KPI Group
-
KPI Name
-
Unit
-
Formula
-
KPI Definition
-
KPI Type (LTB or UTB)
This information powers the KPI Definition Page in Power BI.
Click to Purchases Incubators and Accelerators KPI Dashboard in Power BI
Advantages of Incubators and Accelerators KPI Dashboard in Power BI
Organizations gain several benefits when they implement this dashboard.
Improved Startup Program Monitoring
The dashboard tracks startup performance in real time. Therefore, managers monitor progress easily.
Faster Decision Making
Because leaders view performance instantly, they make data-driven decisions quickly.
Centralized Data Management
The dashboard consolidates all KPI data into one platform. As a result, teams eliminate scattered reports.
Performance Transparency
Stakeholders gain clear visibility into incubator outcomes.
Therefore, organizations strengthen accountability.
Trend Analysis
Historical comparisons help organizations identify growth patterns.
Consequently, incubators refine program strategies.
Easy Data Updates
Because the dashboard uses Excel as the data source, users update data easily.
Opportunities for Improvement in Incubator KPI Dashboards
Although KPI dashboards provide powerful insights, organizations can enhance them further.
Integration with Startup Management Systems
Connecting the dashboard to CRM or startup management platforms can automate data collection.
Real-Time Data Updates
Organizations can connect Power BI with cloud databases for live updates.
Advanced Startup Analytics
Adding predictive analytics can help incubators forecast startup success.
Benchmark Comparisons
Incubators can compare their performance with industry benchmarks.
Startup Portfolio Risk Analysis
Risk analysis can help identify struggling startups earlier.
Best Practices for the Incubators and Accelerators KPI Dashboard in Power BI
Organizations must follow best practices to maximize dashboard effectiveness.
Define Clear KPIs
Organizations should select KPIs that align with program objectives.
Maintain Data Accuracy
Teams must update Excel data regularly to maintain reliable insights.
Use Consistent Measurement Units
Standardized KPI units prevent reporting confusion.
Monitor Trends Regularly
Monthly reviews help organizations detect performance changes early.
Train Users
Teams must understand dashboard functionality to use it effectively.
Continuously Improve KPIs
Startup ecosystems evolve constantly. Therefore, organizations must review KPIs regularly.
Who Can Use This Dashboard?
This dashboard serves many organizations within the startup ecosystem.
Examples include:
-
Startup incubators
-
Startup accelerators
-
Government innovation programs
-
University incubation centers
-
Venture capital firms
-
Corporate innovation labs
Therefore, any organization supporting startup growth can benefit from this dashboard.
Conclusion
Startup incubators and accelerators play a vital role in supporting innovation and entrepreneurship. However, organizations must measure their impact carefully to ensure program success.
The Incubators and Accelerators KPI Dashboard in Power BI provides a powerful solution for monitoring startup ecosystem performance. Because it combines structured KPI tracking, trend analysis, and interactive filters, the dashboard simplifies complex data analysis.
Moreover, the dashboard uses Excel as a data source, which makes data management easy for teams. As a result, organizations track program performance efficiently and make better decisions.
Therefore, incubators, accelerators, and innovation hubs should adopt KPI dashboards to improve transparency, monitor startup growth, and maximize program success.
Frequently Asked Questions (FAQs)
What is an incubator KPI dashboard?
An incubator KPI dashboard is a data visualization tool that tracks startup program performance using measurable indicators.
Why should incubators use Power BI dashboards?
Power BI dashboards provide interactive analytics, real-time reporting, and powerful data visualization capabilities.
What KPIs should incubators track?
Common incubator KPIs include:
-
Number of startups incubated
-
Funding raised
-
Startup graduation rate
-
Startup survival rate
-
Revenue growth
Can organizations customize the dashboard?
Yes. Organizations can modify KPIs, charts, and metrics according to their program requirements.
Do users need advanced technical skills to use the dashboard?
No. Users only need to update Excel data and refresh the Power BI report.
How often should organizations update KPI data?
Most organizations update KPI data monthly. However, some incubators update data weekly or quarterly depending on reporting needs.
Visit our YouTube channel to learn step-by-step video tutorials