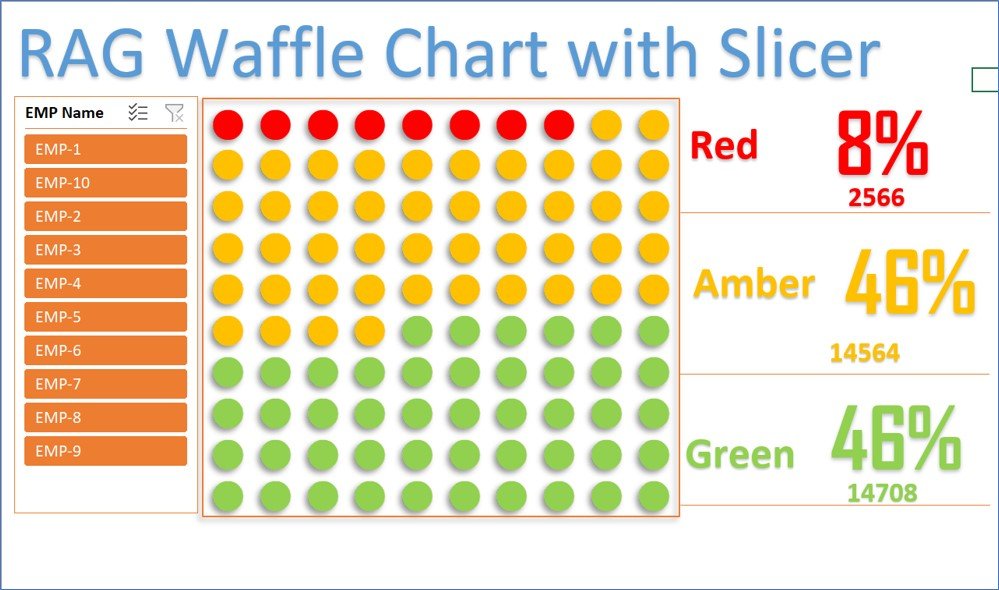
RAG waffle Chart visualization with Slicer
In this article, we have create a RAG waffle Chart visualization with slicer to display the Red, Amber and Green percentage. We have used Conditional Formatting and linked picture feature
Transforming Data into Decisions