Yoga has become more than a wellness practice. Today, yoga centres operate as professional service businesses that manage sessions, memberships, instructors, costs, and customer experience every single day. Because competition continues to grow and customer expectations keep rising, yoga centre owners can no longer depend on intuition or scattered spreadsheets. Instead, they need clear, visual, and reliable insights.
That is exactly where a Yoga Centres Dashboard in Power BI plays a critical role.
In this detailed, SEO-friendly, and easy-to-understand article, you will learn what a Yoga Centres Dashboard in Power BI is, why it matters, how it works, its page-wise structure, key metrics, advantages, best practices, challenges, and frequently asked questions. Moreover, this guide uses simple language, strong transitions, and practical explanations so that you can implement it confidently.
Click to Purchases Yoga Centres Dashboard in Power BI
What Is a Yoga Centres Dashboard in Power BI?
A Yoga Centres Dashboard in Power BI is an interactive business intelligence solution designed to track, analyze, and visualize the performance of yoga studios and wellness centres.
Instead of managing data across multiple Excel sheets or manual reports, this dashboard consolidates session fees, attendance, customer ratings, costs, revenue, profit, and margins into a single Power BI report. As a result, decision-makers gain instant clarity across cities, regions, yoga styles, membership types, and time periods.
Because Power BI updates visuals dynamically, users can filter data using slicers and explore insights in seconds. Consequently, yoga centre owners can make faster, smarter, and more confident decisions.
Why Do Yoga Centres Need a Power BI Dashboard?
Yoga centres deal with multiple moving parts every day. For example, they manage different yoga styles, customer demographics, membership plans, locations, and monthly trends. However, when data stays scattered, problems remain hidden.
A Yoga Centres Dashboard in Power BI solves these challenges effectively.
Key Reasons Why This Dashboard Matters
-
It centralizes all business data in one place
-
It eliminates manual reporting and repetitive calculations
-
It highlights profitable and underperforming areas instantly
-
It improves pricing, marketing, and capacity planning decisions
-
It supports data-driven growth and scalability
Therefore, yoga centres that adopt dashboards early gain a clear competitive advantage.
How Does a Yoga Centres Dashboard in Power BI Work?
The Yoga Centres Dashboard in Power BI works by connecting structured data—usually from Excel, Google Sheets, or databases—to a Power BI Desktop file.
First, users maintain clean data such as session fees, attendance, costs, revenue, ratings, regions, yoga styles, and membership types. Next, Power BI processes this data using relationships, measures, and calculations. Finally, interactive visuals present insights clearly across multiple pages.
Because slicers control filters like city, region, yoga style, membership type, and month, users can drill down into details without writing formulas or code.
Click to Purchases Yoga Centres Dashboard in Power BI
What Are the Key Pages in the Yoga Centres Dashboard in Power BI?
This dashboard contains five well-structured pages, each designed to answer specific business questions. Let us explore each page in detail.
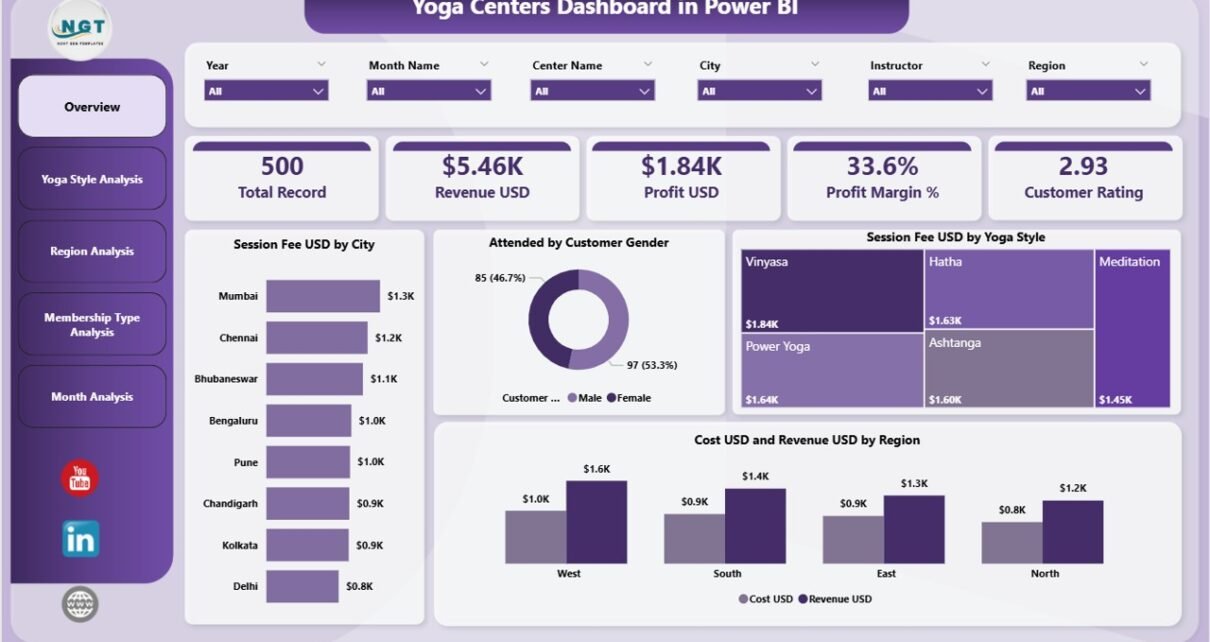
Overview Page: What Is Happening Across All Yoga Centres?
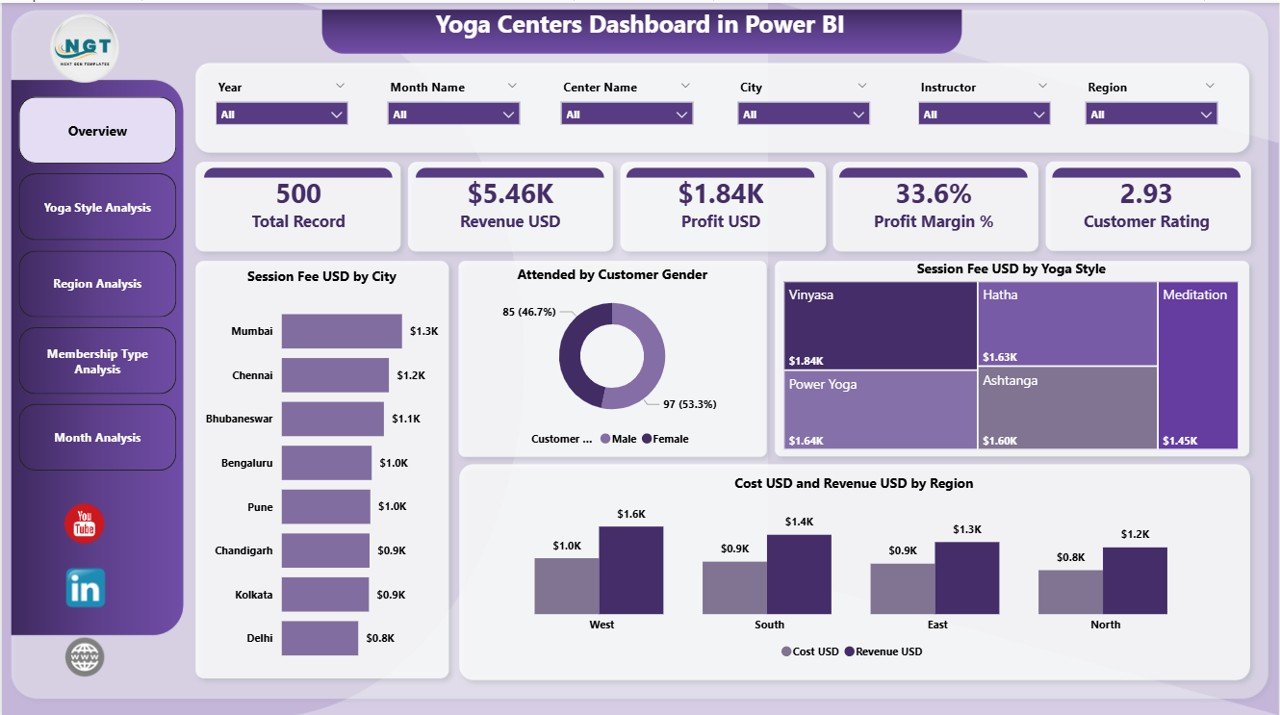
The Overview Page serves as the executive summary of the entire dashboard. Because leaders need quick insights, this page focuses on high-level performance indicators.
Key Elements of the Overview Page
Slicers
-
City
-
Region
-
Yoga Style
-
Membership Type
-
Month
Cards
-
Total Session Fee (USD)
-
Total Revenue (USD)
-
Total Cost (USD)
-
Total Profit (USD)
Charts
-
Session Fee USD by City – Shows which cities generate higher session income
-
Attended by Customer Gender – Displays gender-wise participation distribution
-
Session Fee USD by Yoga Style – Highlights popular and high-value yoga styles
-
Cost USD and Revenue USD by Region – Compares expenses and earnings across regions
-
Click to Purchases Yoga Centres Dashboard in Power BI
Because this page provides a snapshot view, managers can quickly identify where the business performs well and where attention is needed.
Yoga Style Analysis: Which Yoga Styles Drive Profitability?
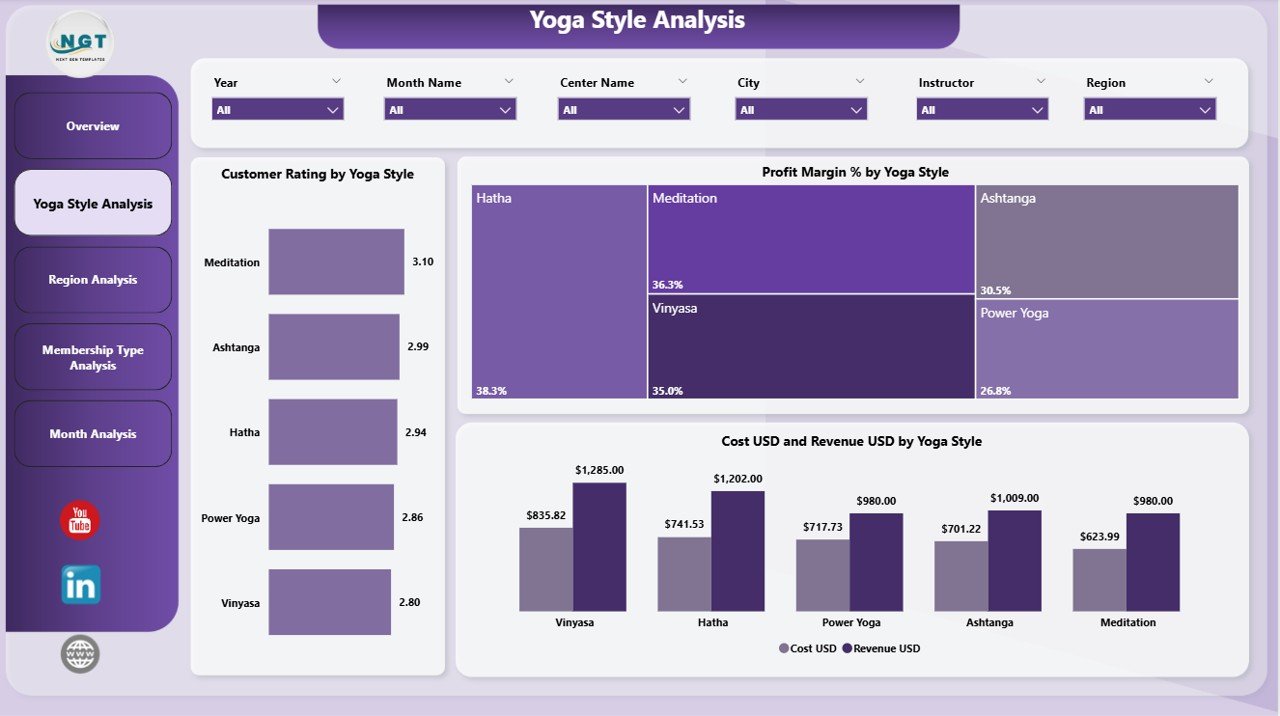
The Yoga Style Analysis Page focuses on performance by yoga type. Since different styles attract different audiences and costs, this analysis becomes extremely valuable.
Charts on Yoga Style Analysis Page
-
Customer Rating by Yoga Style
-
Profit Margin % by Yoga Style
-
Cost USD and Revenue USD by Yoga Style
Why This Page Matters
-
It helps identify high-rated yoga styles
-
It highlights styles with strong or weak margins
-
It supports decisions on class scheduling and instructor allocation
As a result, yoga centres can expand profitable styles while optimizing or redesigning low-performing ones.
Region Analysis: Which Regions Perform Better?
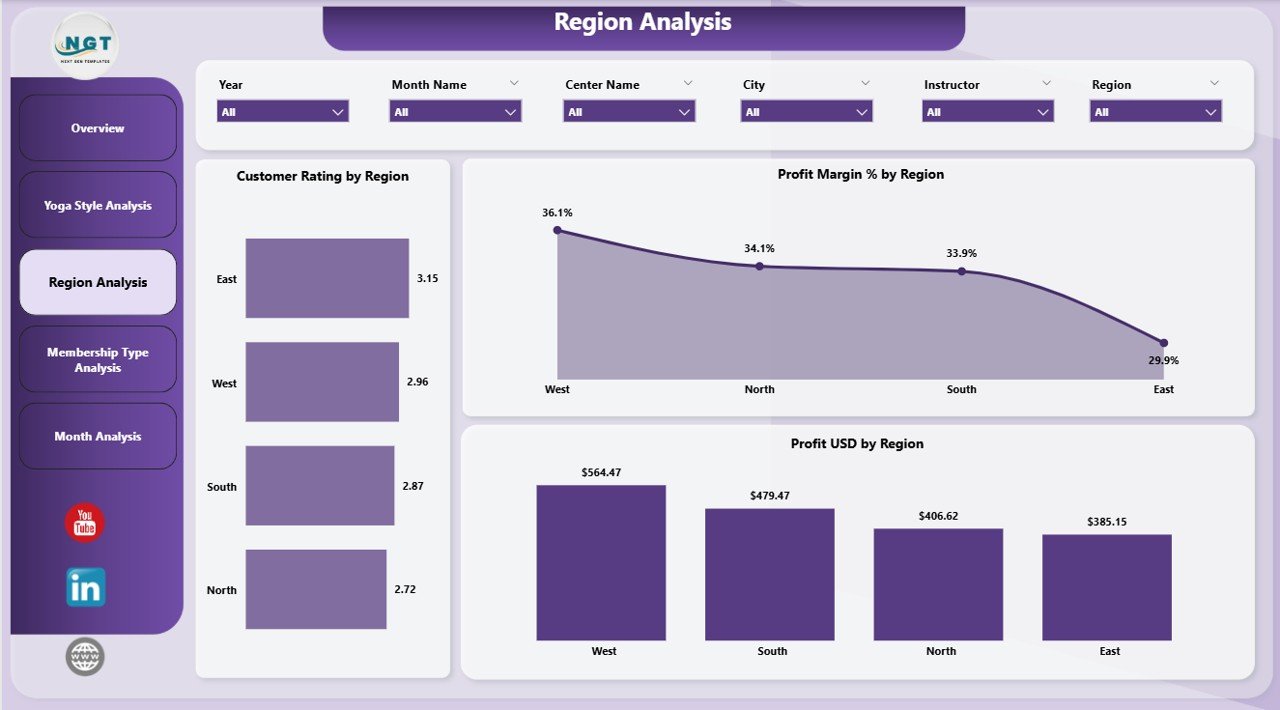
The Region Analysis Page compares performance across different geographical regions. Because operational costs and customer behavior vary by location, this page delivers critical insights.
Charts on Region Analysis Page
-
Customer Rating by Region
-
Profit Margin % by Region
-
Profit USD by Region
Business Value of Region Analysis
-
Identifies high-performing regions
-
Flags regions with low satisfaction or profitability
-
Supports regional expansion or consolidation strategies
Therefore, management can allocate marketing budgets and resources more effectively.
Membership Type Analysis: Which Memberships Deliver Value?
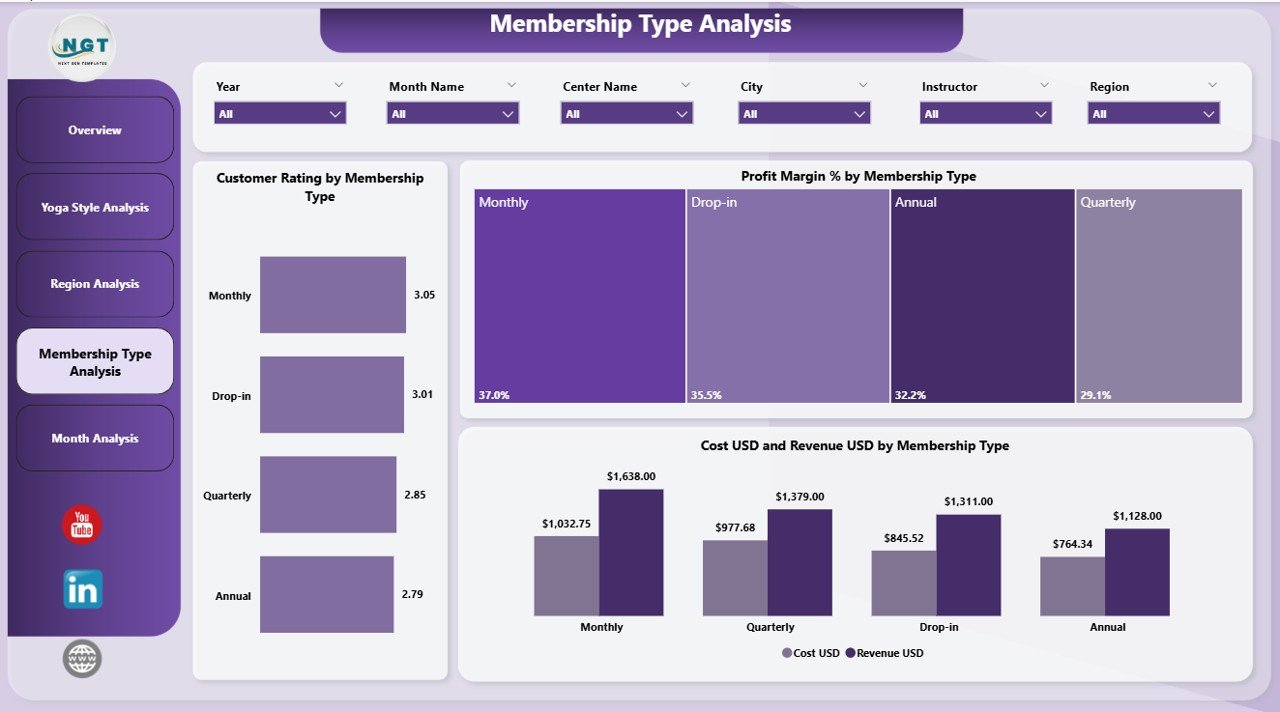
Memberships often form the backbone of yoga centre revenue. The Membership Type Analysis Page helps evaluate how each membership performs.
Charts on Membership Type Analysis Page
-
Customer Rating by Membership Type
-
Profit Margin % by Membership Type
-
Cost USD and Revenue USD by Membership Type
Key Insights from This Page
-
Identifies popular and profitable membership plans
-
Highlights memberships with high cost but low returns
-
Supports pricing and package redesign decisions
Because membership optimization directly impacts retention and revenue, this page proves extremely valuable.
Monthly Trends: How Is the Business Performing Over Time?
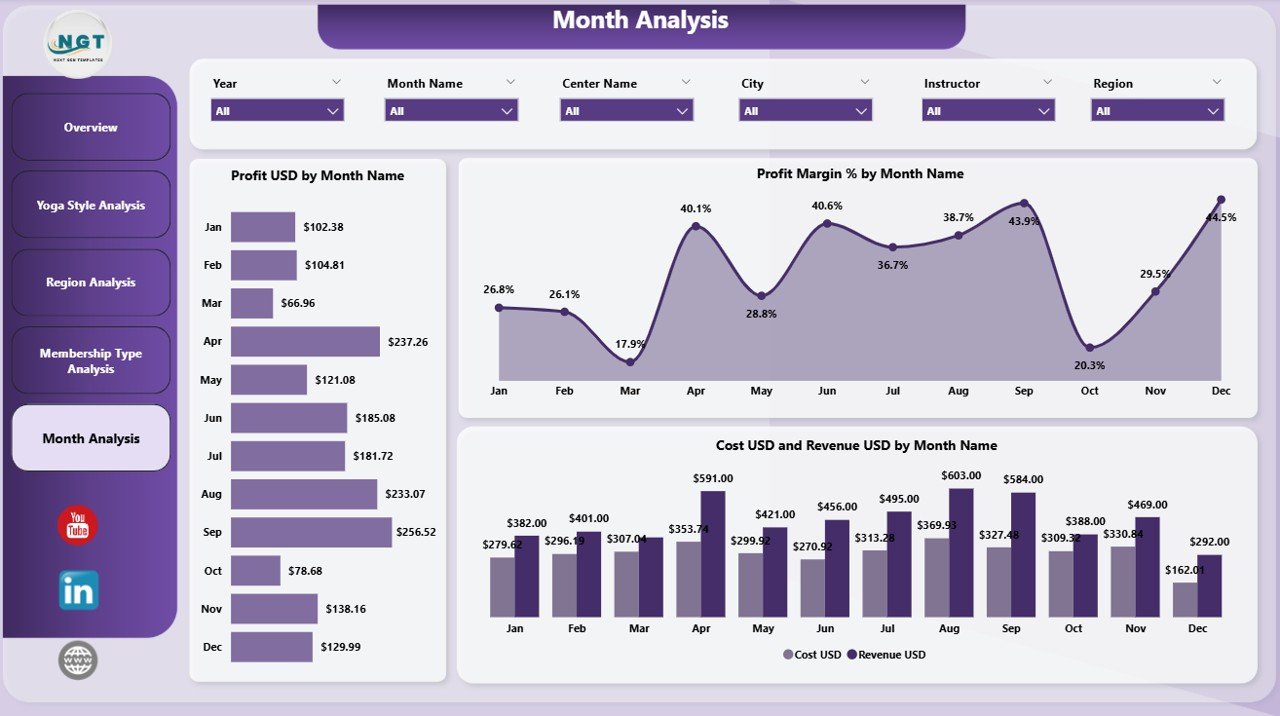
The Monthly Trends Page tracks performance changes over time. Since seasonality affects yoga attendance, this analysis becomes essential.
Charts on Monthly Trends Page
-
Profit USD by Month
-
Profit Margin % by Month
-
Cost USD and Revenue USD by Month
Why Trend Analysis Is Important
-
Identifies seasonal demand patterns
-
Detects cost spikes or revenue drops early
-
Supports forecasting and planning
As a result, yoga centres can prepare promotions, staffing, and budgets proactively.
What Key Metrics Does a Yoga Centres Dashboard Track?
A Yoga Centres Dashboard in Power BI typically tracks the following metrics:
-
Session Fee (USD)
-
Attendance Count
-
Customer Gender Distribution
-
Customer Rating
-
Cost (USD)
-
Revenue (USD)
-
Profit (USD)
-
Profit Margin (%)
-
Performance by City, Region, Yoga Style, Membership Type, and Month
-
Click to Purchases Yoga Centres Dashboard in Power BI
Because these metrics cover financial, operational, and customer experience aspects, the dashboard provides a 360-degree business view.
Advantages of Yoga Centres Dashboard in Power BI
1. Centralized Data Visibility
This dashboard brings all key metrics into one unified view. Therefore, users no longer switch between multiple reports.
2. Faster Decision-Making
Because insights update instantly with slicers, decisions become quicker and more confident.
3. Improved Profitability Tracking
The dashboard clearly shows profit and margin trends. As a result, cost control becomes easier.
4. Better Customer Experience Insights
Customer ratings by style, region, and membership reveal what customers truly value.
5. Scalability and Flexibility
As yoga centres grow, users can easily add new locations, styles, or membership plans.
Best Practices for the Yoga Centres Dashboard in Power BI
To maximize value, follow these proven best practices.
1. Maintain Clean and Structured Data
Always standardize city names, yoga styles, and membership types. Clean data ensures accurate insights.
2. Use Consistent Date Formats
Consistent date formats improve monthly and trend analysis accuracy.
3. Focus on Actionable Metrics
Avoid clutter. Track only metrics that support decisions and growth.
4. Review the Dashboard Regularly
Weekly or monthly reviews help catch issues early.
5. Train Team Members
Ensure managers understand how to use slicers and interpret visuals.
What Challenges Do Yoga Centres Face Without a Dashboard?
Without a dashboard, yoga centres often struggle with:
-
Delayed reporting
-
Inconsistent numbers
-
Poor visibility into costs and profits
-
Difficulty comparing regions or styles
-
Reactive decision-making
However, a Power BI dashboard eliminates these challenges effectively.
Who Can Benefit from a Yoga Centres Dashboard in Power BI?
This dashboard benefits a wide range of users:
-
Yoga studio owners
-
Wellness centre managers
-
Operations teams
-
Finance and accounting teams
-
Marketing and growth managers
Because the dashboard adapts to different roles, everyone gains relevant insights.
How Does This Dashboard Support Business Growth?
A Yoga Centres Dashboard in Power BI supports growth by:
-
Identifying profitable expansion opportunities
-
Optimizing pricing and memberships
-
Improving customer satisfaction
-
Reducing operational inefficiencies
-
Supporting long-term strategic planning
As a result, yoga centres move from reactive management to proactive leadership.
Conclusion: Why Should You Use a Yoga Centres Dashboard in Power BI?
A Yoga Centres Dashboard in Power BI transforms how yoga studios manage performance. Instead of relying on assumptions, leaders gain real-time, data-driven insights across financials, operations, and customer experience.
Because this dashboard offers structured pages, interactive visuals, and actionable metrics, it becomes an essential tool for sustainable growth. Whether you manage a single studio or multiple centres across regions, this dashboard helps you stay in control, improve profitability, and deliver better value to your customers.
Frequently Asked Questions (FAQs)
What is a Yoga Centres Dashboard in Power BI used for?
A Yoga Centres Dashboard in Power BI tracks financial, operational, and customer performance metrics for yoga studios in one interactive report.
Can small yoga studios use this dashboard?
Yes, small studios benefit greatly because the dashboard simplifies reporting and decision-making without complex systems.
What data source does this dashboard use?
Most yoga centres use Excel or Google Sheets as the data source, which Power BI connects seamlessly.
Does this dashboard require technical skills?
No, users only need basic Power BI navigation skills to use slicers and read visuals.
How often should the data be updated?
Ideally, update data weekly or monthly to keep insights accurate and relevant.
Can the dashboard be customized?
Yes, Power BI dashboards are fully customizable based on business needs, metrics, and branding.
Visit our YouTube channel to learn step-by-step video tutorials


