Managing hedge fund performance without clear visibility often creates blind spots, delayed decisions, and missed opportunities. However, modern investment teams no longer rely on static reports or scattered spreadsheets. Instead, they use interactive analytics dashboards that deliver real-time insights, performance comparisons, and strategic clarity.
That is exactly where a Hedge Funds Dashboard in Power BI becomes a game-changer.
In this in-depth guide, you will learn what a Hedge Funds Dashboard in Power BI is, why hedge funds need it, how it works, its structure and key features, advantages, best practices, and frequently asked questions. By the end of this article, you will clearly understand how this ready-to-use dashboard helps hedge fund managers, analysts, and investors make faster and more confident decisions.
Click to Purchases Credit Hedge Funds Dashboard in Power BI
What Is a Hedge Funds Dashboard in Power BI?
A Hedge Funds Dashboard in Power BI is an interactive data visualization solution designed to track, analyze, and monitor hedge fund performance metrics in one centralized platform.
Instead of reviewing multiple reports for returns, assets under management, or fund activity, users can view all critical hedge fund KPIs on a single dashboard. As a result, decision-makers gain instant clarity on fund performance, strategy effectiveness, regional exposure, and monthly trends.
Because the dashboard runs on Microsoft Power BI, it allows users to:
-
Interact with slicers
-
Drill down into detailed views
-
Compare performance across multiple dimensions
-
Refresh data automatically from Excel or databases
Therefore, hedge fund teams gain speed, accuracy, and strategic control.
Why Do Hedge Funds Need a Power BI Dashboard?
Hedge funds operate in a fast-moving and data-intensive environment. Because of that, traditional reporting methods often fail to keep pace.
A Hedge Funds Dashboard in Power BI solves this problem by offering:
-
Real-time performance tracking
-
Clear visibility across strategies, regions, and countries
-
Faster comparison of returns and benchmarks
-
Improved reporting for internal teams and stakeholders
Moreover, when teams use a structured dashboard, they reduce manual effort and eliminate reporting errors. Consequently, they focus more on strategy and less on data preparation.
How Does a Hedge Funds Dashboard in Power BI Work?
The dashboard works by connecting structured hedge fund data—typically stored in Excel or databases—to Power BI. After that, Power BI transforms the data into interactive visuals and KPIs.
Here is how the process flows:
-
Data Input
Hedge fund data gets captured in Excel or another data source. -
Data Modeling
Power BI cleans, organizes, and structures the data using relationships and measures. -
Visualization
Charts, cards, tables, and slicers present insights clearly. -
Interaction
Users filter data by strategy, region, country, or month.
As a result, users analyze performance instantly without writing formulas or creating manual charts.
This Hedge Funds Dashboard includes five professionally designed pages, each serving a specific analytical purpose.
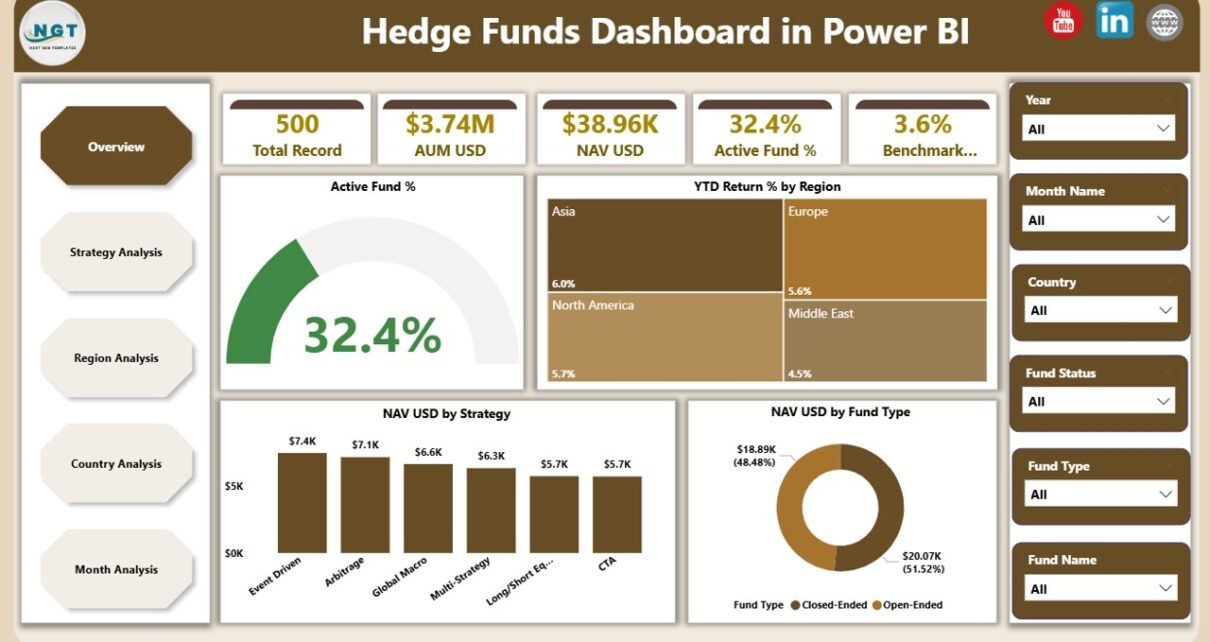
1. Overview Page: How Can You See the Big Picture Instantly?
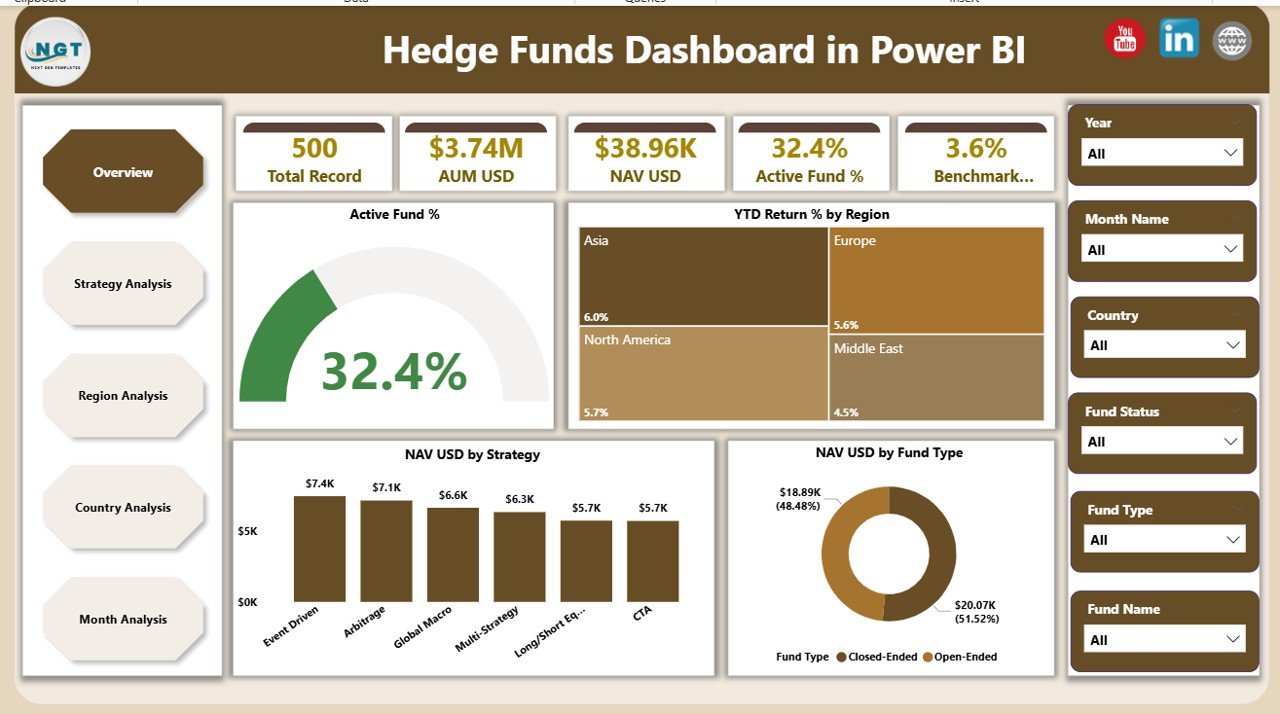
The Overview Page acts as the control center of the dashboard. It provides a high-level snapshot of hedge fund performance.
Key Features of the Overview Page
-
Interactive slicers for dynamic filtering
-
Five KPI cards showing:
-
Active Fund %
-
YTD Return % by Region
-
NAV USD by Strategy
-
NAV USD by Fund Type
-
Overall fund activity insights
-
Because everything appears on one screen, stakeholders quickly understand how funds perform without drilling into details.
Click to Purchases Credit Hedge Funds Dashboard in Power BI
2. Strategy Analysis Page: Which Investment Strategies Perform Best?
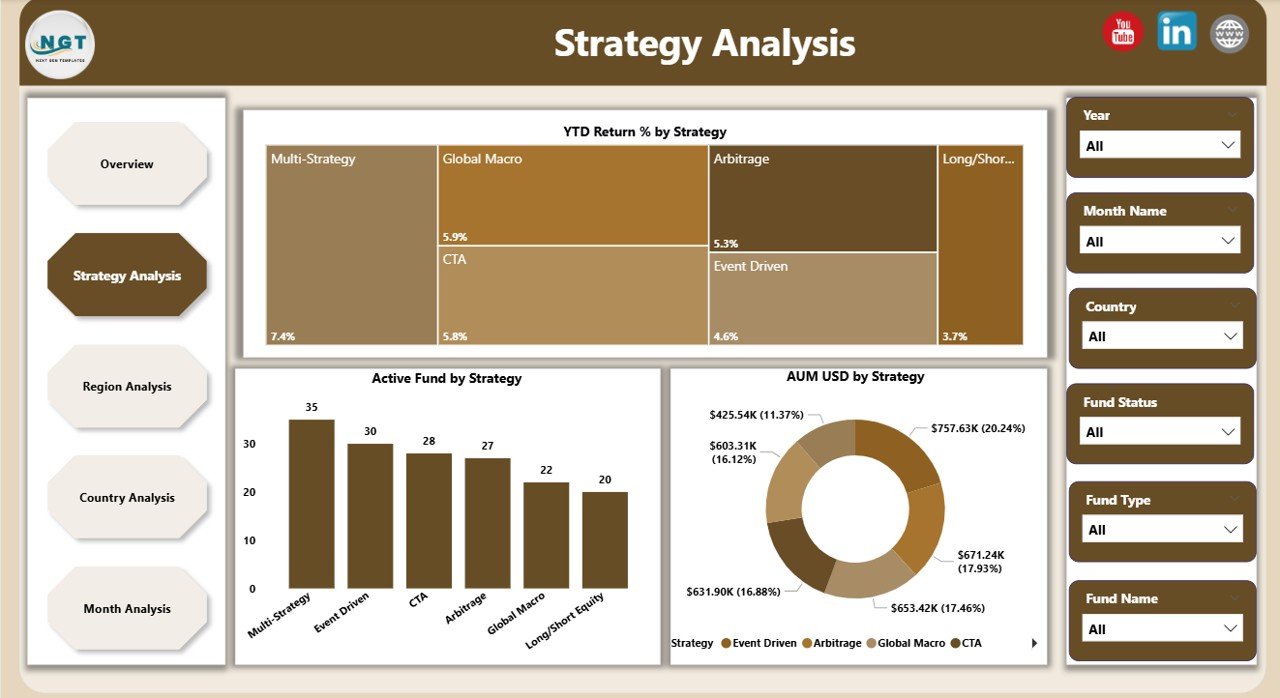
The Strategy Analysis Page focuses on evaluating hedge fund performance by strategy.
Visuals Included on This Page
-
YTD Return % by Strategy
-
AUM USD by Strategy
-
Active Fund by Strategy
This page helps portfolio managers identify:
-
High-performing strategies
-
Strategies with growing assets
-
Strategies requiring optimization
Therefore, teams allocate capital more effectively.
3. Region Analysis Page: How Do Funds Perform Across Regions?
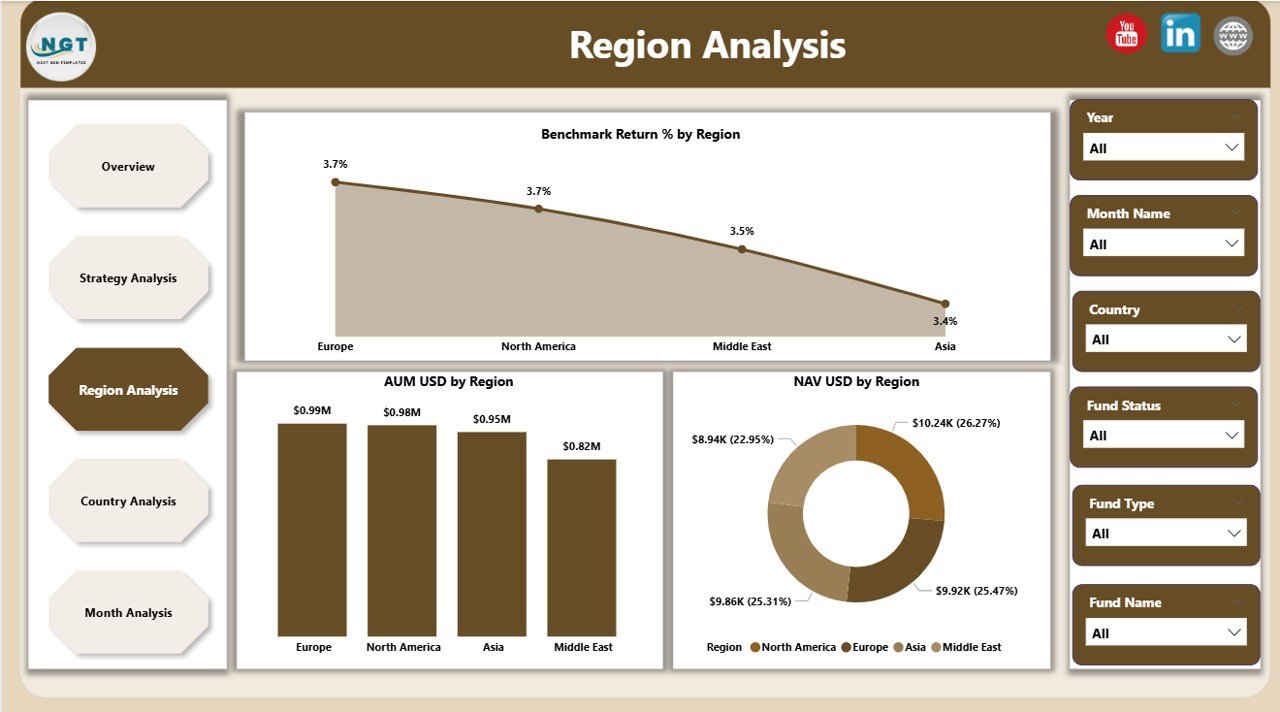
The Region Analysis Page highlights geographical performance differences.
Key Charts on the Region Analysis Page
-
Benchmark Return % by Region
-
AUM USD by Region
-
NAV USD by Region
With this page, decision-makers compare regional exposure and returns side by side. Consequently, they rebalance portfolios based on global performance trends.
4. Country Analysis Page: Which Countries Drive Returns?
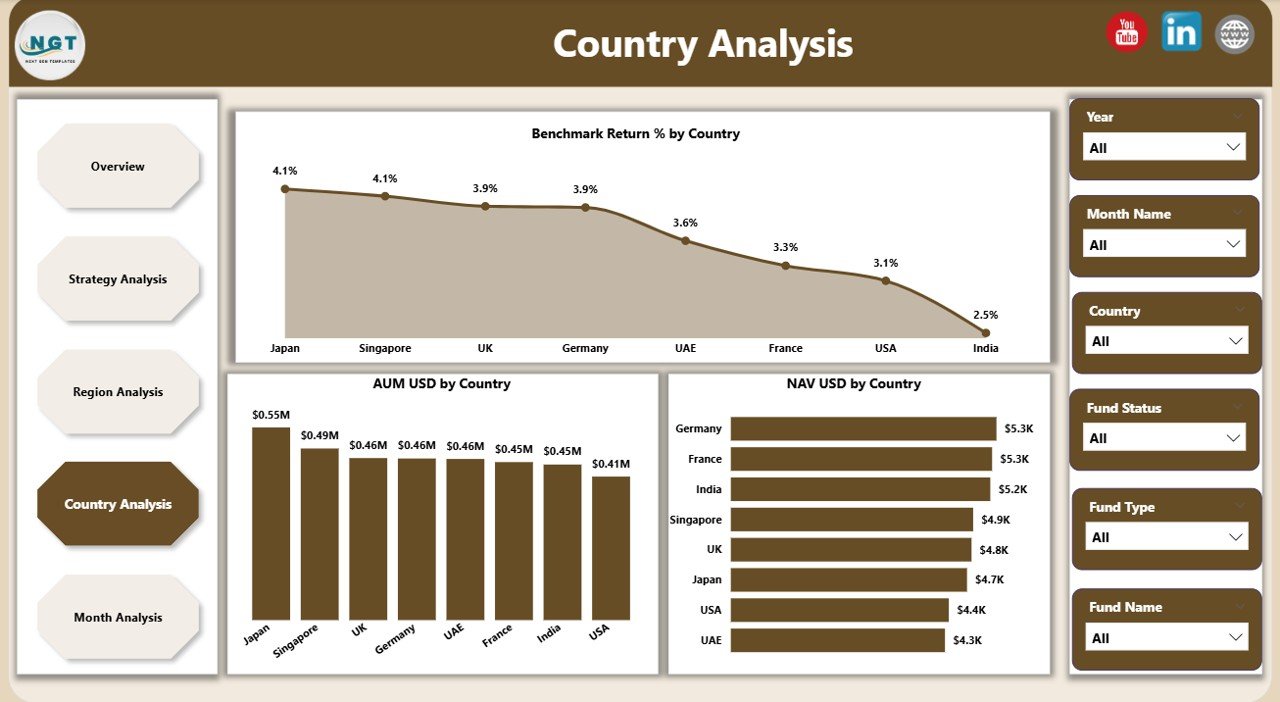
The Country Analysis Page drills deeper into country-level performance.
Charts Available on This Page
-
Benchmark Return % by Country
-
AUM USD by Country
-
NAV USD by Country
Because of this granular view, hedge fund teams:
-
Identify top-performing markets
-
Detect underperforming regions early
-
Adjust country-level allocation strategies
5. Month Analysis Page: How Does Performance Change Over Time?
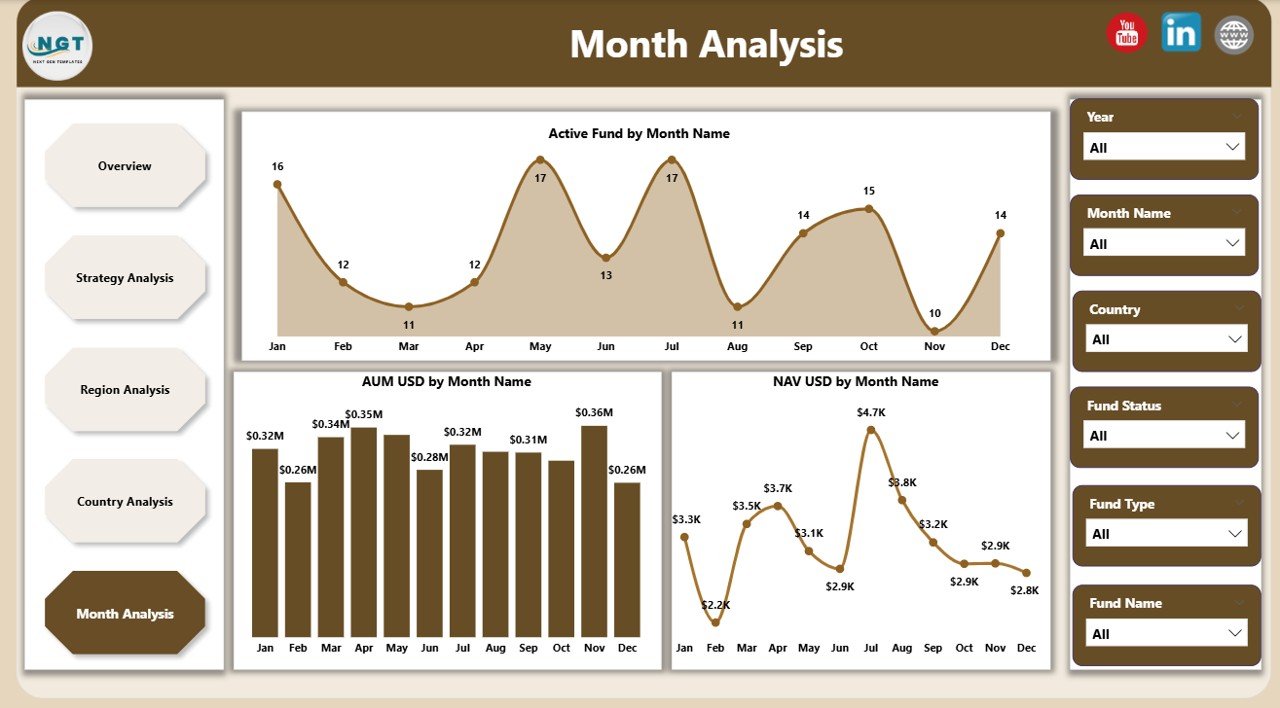
The Month Analysis Page tracks performance trends over time.
Metrics Displayed on This Page
-
Active Fund by Month
-
AUM USD by Month
-
NAV USD by Month
This page allows users to monitor growth, seasonality, and monthly fluctuations. As a result, forecasting and planning become more accurate.
Advantages of a Hedge Funds Dashboard in Power BI
Click to Purchases Credit Hedge Funds Dashboard in Power BI
A Hedge Funds Dashboard in Power BI delivers multiple business advantages. Because it combines analytics and interactivity, it transforms how hedge fund teams work.
Key Advantages
-
Centralized reporting
All hedge fund KPIs stay in one place. -
Faster decision-making
Real-time insights reduce delays. -
Improved transparency
Stakeholders see clear and consistent data. -
Scalable design
The dashboard grows with your fund portfolio. -
Reduced manual effort
Automated visuals replace manual reports.
Therefore, hedge funds gain a competitive edge in a demanding market.
How Does Power BI Improve Hedge Fund Reporting?
Power BI enhances hedge fund reporting by offering:
-
Interactive slicers instead of static filters
-
Drill-down capabilities for deeper analysis
-
Automatic data refresh
-
High-performance visuals
Because of these features, teams spend less time preparing reports and more time analyzing insights.
Who Can Use a Hedge Funds Dashboard in Power BI?
This dashboard suits a wide range of users, including:
-
Hedge fund managers
-
Portfolio managers
-
Investment analysts
-
Risk management teams
-
Financial controllers
-
Executive leadership
Since the dashboard uses a clean and intuitive design, both technical and non-technical users can navigate it easily.
Best Practices for the Hedge Funds Dashboard in Power BI
To get the most value from your Hedge Funds Dashboard, follow these best practices.
1. Use Clean and Structured Data
Always maintain consistent formats for dates, currencies, and categories. Clean data ensures accurate visuals.
2. Limit Overcrowding
Show only meaningful KPIs on each page. Clear visuals improve decision-making.
3. Use Consistent Naming
Keep strategy, region, and country names consistent across datasets.
4. Refresh Data Regularly
Schedule frequent refreshes to keep insights up to date.
5. Design for Decision-Making
Focus on insights that support investment decisions, not just visuals.
By following these practices, your dashboard remains reliable, scalable, and impactful.
How Does This Dashboard Support Risk and Performance Management?
The Hedge Funds Dashboard supports both performance tracking and risk monitoring.
-
It highlights underperforming strategies early
-
It shows regional and country exposure clearly
-
It tracks asset concentration trends
-
It supports benchmark comparison
As a result, hedge funds manage risks proactively while optimizing returns.
Can This Dashboard Be Customized?
Yes, the Hedge Funds Dashboard in Power BI is highly customizable.
You can:
-
Add new KPIs
-
Include additional strategies or regions
-
Modify visuals and color themes
-
Connect live data sources
Because of Power BI’s flexibility, the dashboard adapts to different hedge fund models.
Conclusion: Why Should You Use a Hedge Funds Dashboard in Power BI?
A Hedge Funds Dashboard in Power BI transforms raw investment data into actionable insights. Instead of working with disconnected reports, hedge fund teams gain a unified view of performance, strategies, regions, and trends.
Because the dashboard offers interactivity, automation, and clarity, it helps teams:
-
Make faster decisions
-
Improve transparency
-
Optimize investment strategies
-
Strengthen stakeholder confidence
In today’s data-driven investment landscape, this dashboard is not optional—it is essential.
Click to Purchases Credit Hedge Funds Dashboard in Power BI
Frequently Asked Questions About Hedge Funds Dashboard in Power BI
What data do I need for a Hedge Funds Dashboard in Power BI?
You need structured hedge fund data such as AUM, NAV, returns, strategies, regions, countries, and time periods.
Can beginners use a Hedge Funds Dashboard in Power BI?
Yes. The dashboard uses an intuitive design, so even non-technical users can navigate it easily.
Does this dashboard support multiple funds?
Yes. You can track multiple funds, strategies, and regions within the same dashboard.
How often can the dashboard refresh data?
You can refresh data daily, hourly, or in real time depending on your data source.
Is Power BI suitable for institutional hedge funds?
Absolutely. Power BI scales well and supports enterprise-level security and performance needs.
Visit our YouTube channel to learn step-by-step video tutorials