New: NextGenTemplates Academy - video courses on Excel formulas with AI and Pivot Tables & dashboards. Early-bird: 20% off with code EARLYBIRD20 - first 20 orders only. See the courses →
  • Learn Excel (Free Course)
    • 1. Shortcut Keys
    • 2. Fill & Flash Fill
    • 3. Find & Replace
    • 4. Sort & Filter
    • 5. Formulas & Functions
    • 6. Data Validation
    • 7. Conditional Formatting
    • 8. Basic Charts
    • 9. Advanced Charts
    • 10. Pivot Tables
    • 11. Excel Dashboards
    • 12. VBA Course
    • 13. Excel Formulas with AI
  • Templates
  • Tutorials
    • Charts and Visualization
    • VBA
    • Excel Tips and Tricks
    • Excel Dashboards
    • Power Pivot & DAX
  • Power BI
  • Template Store
    • Ready to Use Templates
  • Courses
  • Academy
    • Excel + AI Mastery: 100 Formulas
    • Excel Pivot Tables & Dashboards
  • About Us
  • Contact Us

PK: An Excel Expert

Transforming Data into Decisions

Tag: Power BI Finance

Dashboard Power BI

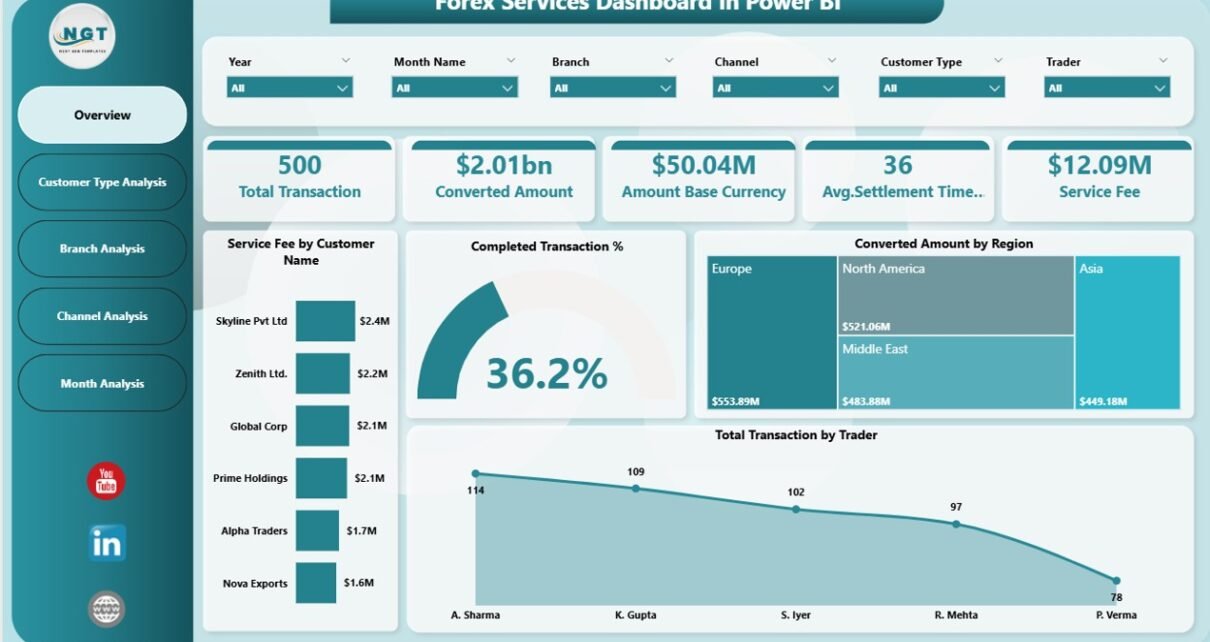
Forex Services Dashboard in Power BI

February 28, 2026February 28, 2026 PKComments Off on Forex Services Dashboard in Power BI
In today’s fast-moving global economy, foreign exchange (Forex) services play a critical role in international trade, remittances, investments, and financial transactions. Financial institutions, currency exchange companies, and brokerage firms process
Read More
Dashboard Power BI

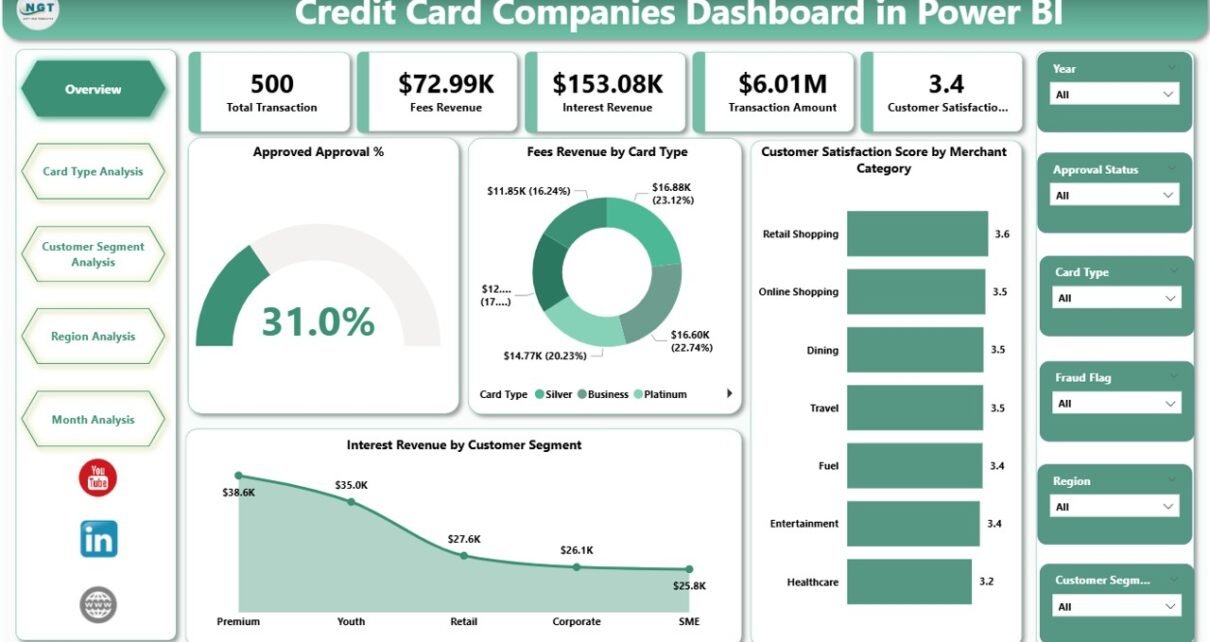
Credit Card Companies Dashboard in Power BI

February 26, 2026February 26, 2026 PKComments Off on Credit Card Companies Dashboard in Power BI
Modern financial institutions operate in a highly competitive and data-driven environment. Credit card companies process millions of transactions every day. Therefore, they must continuously monitor approvals, revenue streams, customer behavior,
Read More
Dashboard Power BI

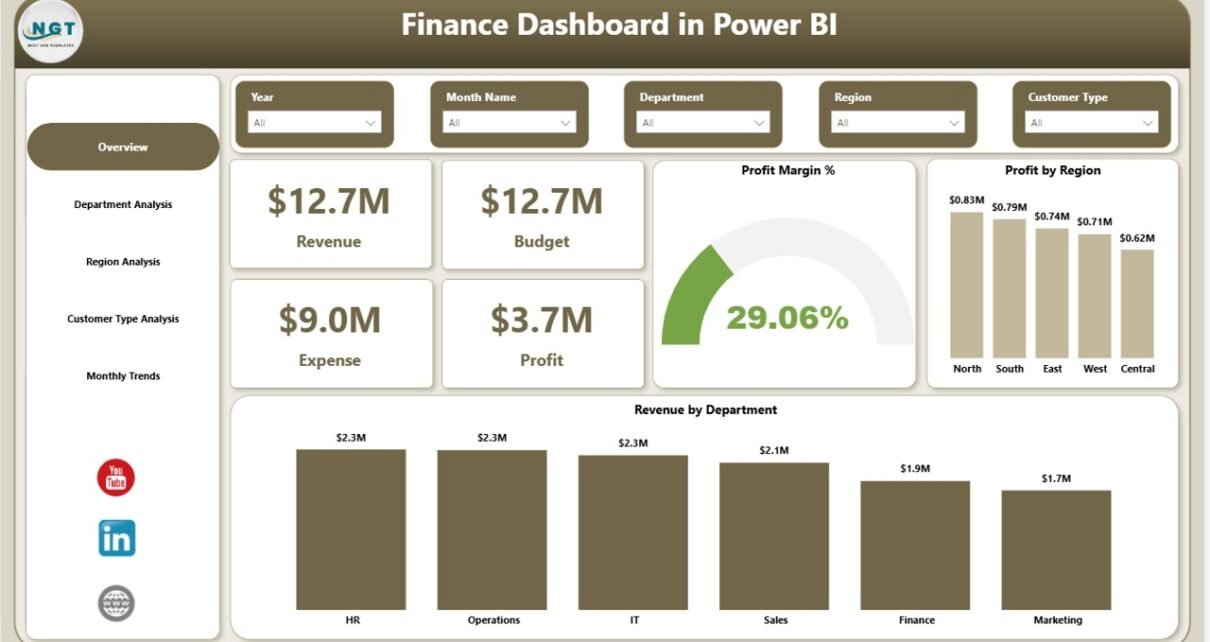
Finance Dashboard in Power BI

February 24, 2026February 24, 2026 PKComments Off on Finance Dashboard in Power BI
Modern businesses generate financial data every single day. Companies record revenue, expenses, budgets, and profits across multiple departments, regions, and customer groups. However, many organizations still struggle to convert this
Read More
Dashboard Power BI

Vendor Payment Dashboard in Power BI

February 6, 2026February 6, 2026 PKComments Off on Vendor Payment Dashboard in Power BI
Managing vendor payments plays a critical role in every organization. However, many finance teams still depend on spreadsheets, emails, and manual tracking systems. As a result, they struggle with delayed
Read More
Dashboard Power BI

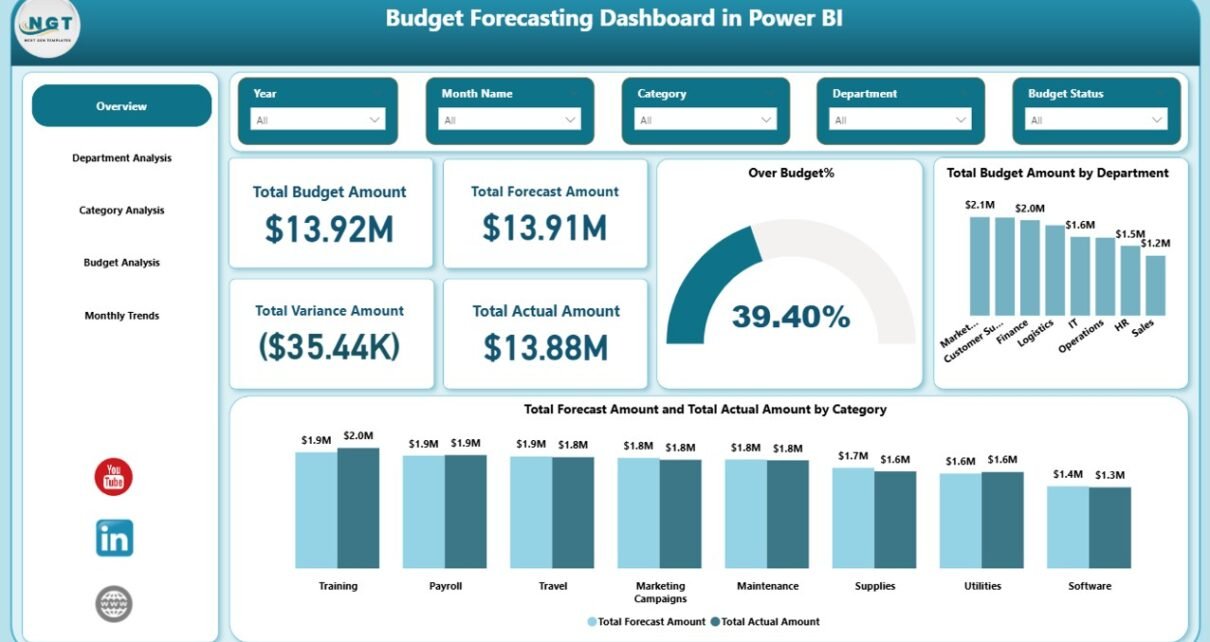
Budget Forecasting Dashboard in Power BI

January 31, 2026January 31, 2026 PKComments Off on Budget Forecasting Dashboard in Power BI
Budget planning plays a critical role in every organization, regardless of size or industry. However, many finance teams still rely on static Excel files, disconnected reports, or manual calculations. As
Read More
Power Pivot

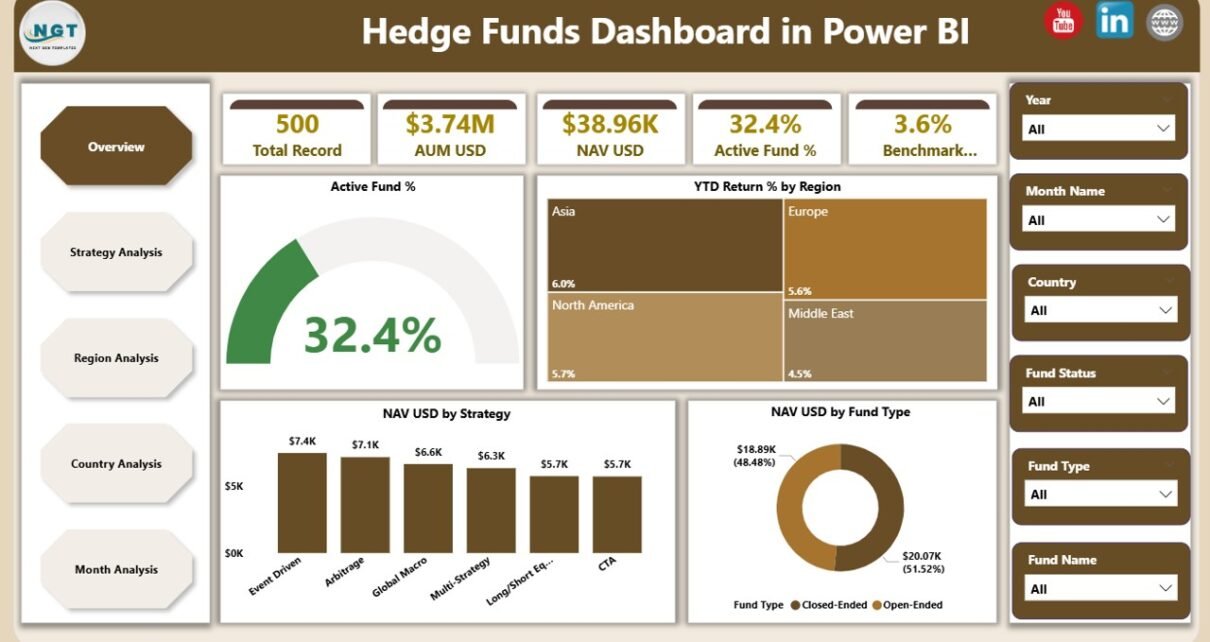
Hedge Funds Dashboard in Power BI

January 24, 2026January 24, 2026 PKComments Off on Hedge Funds Dashboard in Power BI
Managing hedge fund performance without clear visibility often creates blind spots, delayed decisions, and missed opportunities. However, modern investment teams no longer rely on static reports or scattered spreadsheets. Instead,
Read More
Dashboard Power BI

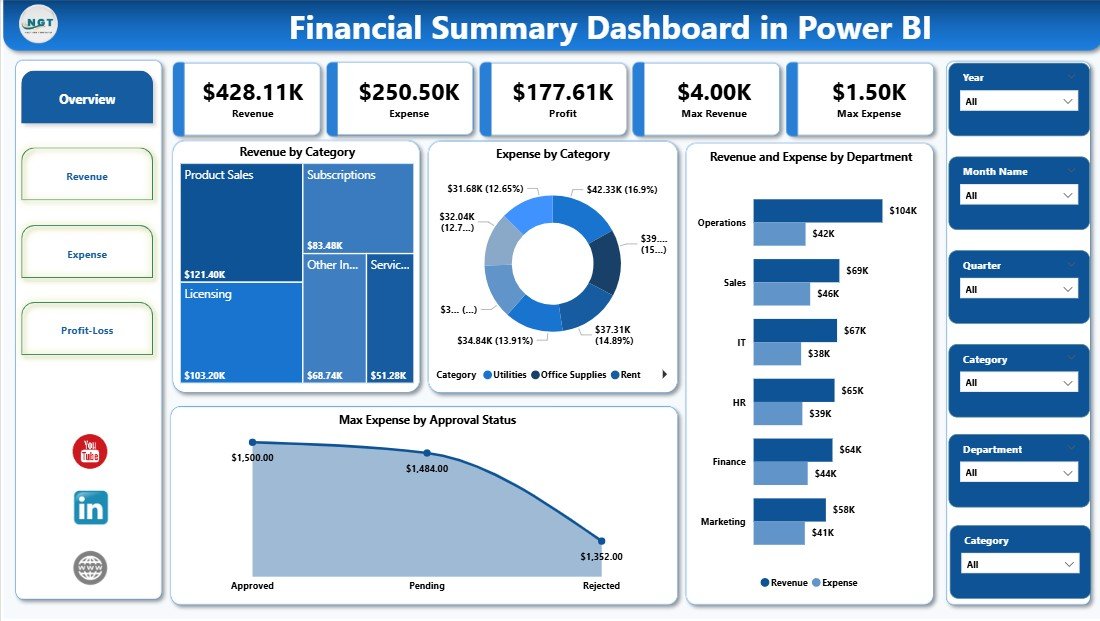
Financial Summary Dashboard in Power BI

January 12, 2026January 12, 2026 PKComments Off on Financial Summary Dashboard in Power BI
Managing finances without clear visibility always creates confusion. Many organizations track revenue, expenses, and profit in separate Excel files. As a result, leaders struggle to understand the complete financial picture.
Read More
Dashboard Power BI

Treasury Operations Dashboard in Power BI

January 6, 2026January 6, 2026 PKComments Off on Treasury Operations Dashboard in Power BI
Treasury operations play a critical role in every organization. Companies manage cash, liquidity, debt, investments, and financial risk on a daily basis. However, many treasury teams still rely on static
Read More
Dashboard Power BI

Derivatives Trading Dashboard in Power BI

January 5, 2026January 5, 2026 PKComments Off on Derivatives Trading Dashboard in Power BI
Derivatives trading continues to grow rapidly across global financial markets. As trading volumes increase, complexity also rises. Therefore, trading desks, risk managers, and finance leaders need clear visibility into positions,
Read More
Dashboard Power BI

Loan Recovery Services Dashboard in Power BI

January 5, 2026January 5, 2026 PKComments Off on Loan Recovery Services Dashboard in Power BI
Loan recovery plays a critical role in maintaining financial stability for banks, NBFCs, microfinance institutions, and lending organizations. However, recovery teams often struggle with scattered Excel sheets, delayed reports, and
Read More

Posts pagination

1 2 Next
  • Learn Excel (Free Course)
    • 1. Shortcut Keys
    • 2. Fill & Flash Fill
    • 3. Find & Replace
    • 4. Sort & Filter
    • 5. Formulas & Functions
    • 6. Data Validation
    • 7. Conditional Formatting
    • 8. Basic Charts
    • 9. Advanced Charts
    • 10. Pivot Tables
    • 11. Excel Dashboards
    • 12. VBA Course
    • 13. Excel Formulas with AI
  • Templates
  • Tutorials
    • Charts and Visualization
    • VBA
    • Excel Tips and Tricks
    • Excel Dashboards
    • Power Pivot & DAX
  • Power BI
  • Template Store
    • Ready to Use Templates
  • Courses
  • Academy
    • Excel + AI Mastery: 100 Formulas
    • Excel Pivot Tables & Dashboards
  • About Us
  • Contact Us
Copyright © 2023 PK-AnExcelExpert.com - Privacy Policy