Mobile apps dominate the digital world. Businesses launch new apps every day. However, only a few teams track performance correctly. Many teams still depend on scattered sheets and manual reports. As a result, they miss trends, delays, cost overruns, and performance gaps.
So, how can you monitor development speed, quality, user growth, and revenue in one place?
The answer is simple.
You need a Mobile App Development KPI Dashboard in Excel.
Click to Purchases Mobile App Development KPI Dashboard in Excel
In this detailed guide, you will learn:
-
What a Mobile App Development KPI Dashboard is
-
Why development teams need it
-
Key features of this ready-to-use Excel template
-
Important KPIs included in the dashboard
-
Advantages of Mobile App Development KPI Dashboard in Excel
-
Best Practices for the Mobile App Development KPI Dashboard
-
Frequently Asked Questions with Answers
Let us explore everything step by step.
What Is a Mobile App Development KPI Dashboard in Excel?
A Mobile App Development KPI Dashboard in Excel is a structured performance tracking tool. It helps app development teams monitor progress, cost, quality, and user metrics in one place.
Instead of checking multiple files, you can:
-
Track Month-to-Date (MTD) performance
-
Compare Actual vs Target values
-
Review Year-to-Date (YTD) results
-
Compare performance with the Previous Year
-
Analyze KPI trends visually
Moreover, Excel provides flexibility. Therefore, you can customize the dashboard based on your project needs. At the same time, you avoid complex software.
Why Do Mobile App Development Teams Need a KPI Dashboard?
Mobile app projects involve multiple moving parts. Developers write code. Designers create UI. QA teams test features. Marketing teams launch campaigns. Product managers track performance.
Because of this complexity, teams often struggle with:
-
Delayed releases
-
High bug counts
-
Budget overruns
-
Low user retention
-
Poor revenue growth
However, when you use a KPI dashboard, you gain full visibility. As a result, you can identify problems early and take action quickly.
What Are the Key Features of the Mobile App Development KPI Dashboard in Excel?
This ready-to-use template includes 7 structured worksheets. Each sheet serves a specific purpose. Therefore, the dashboard works smoothly and efficiently.
Let us understand each sheet clearly.
1️⃣ What Is the Purpose of the Home Sheet?
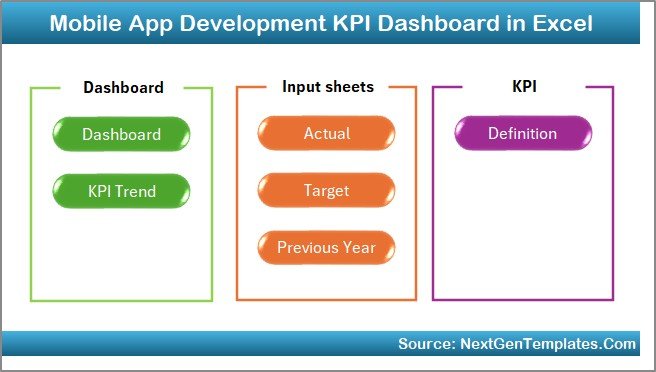
The Home sheet acts as the index page.
Here, you get:
-
6 navigation buttons
-
Quick access to major sheets
-
Smooth workflow management
Instead of scrolling through tabs, you simply click a button. Consequently, you save time and improve usability.
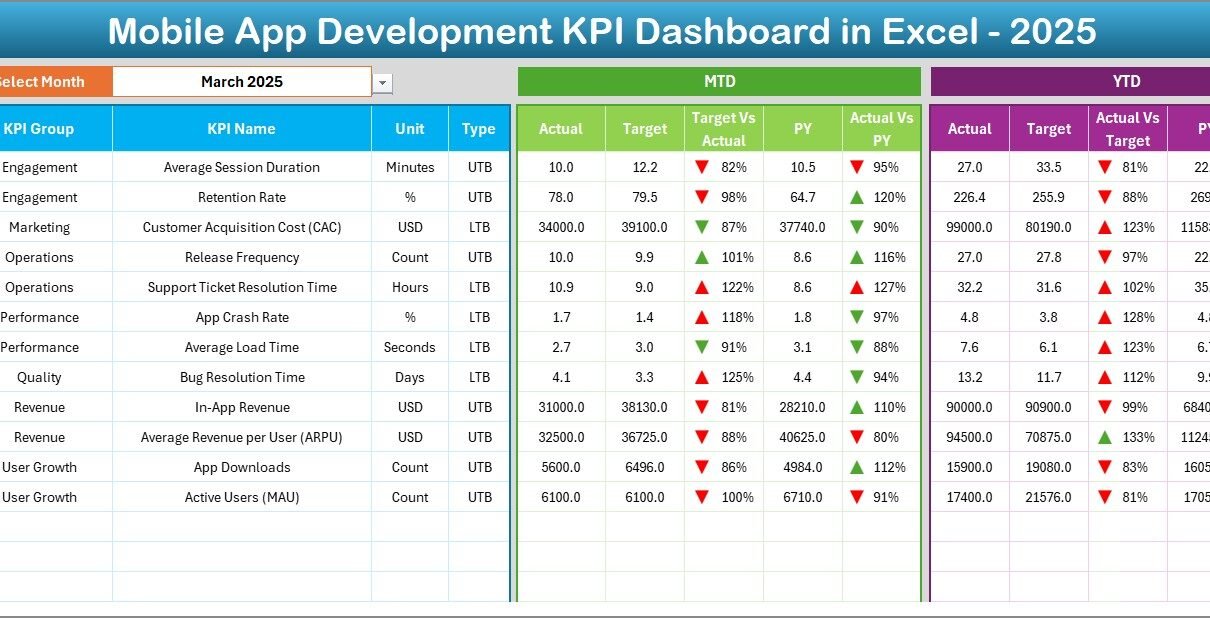
2️⃣ What Does the Dashboard Sheet Display?
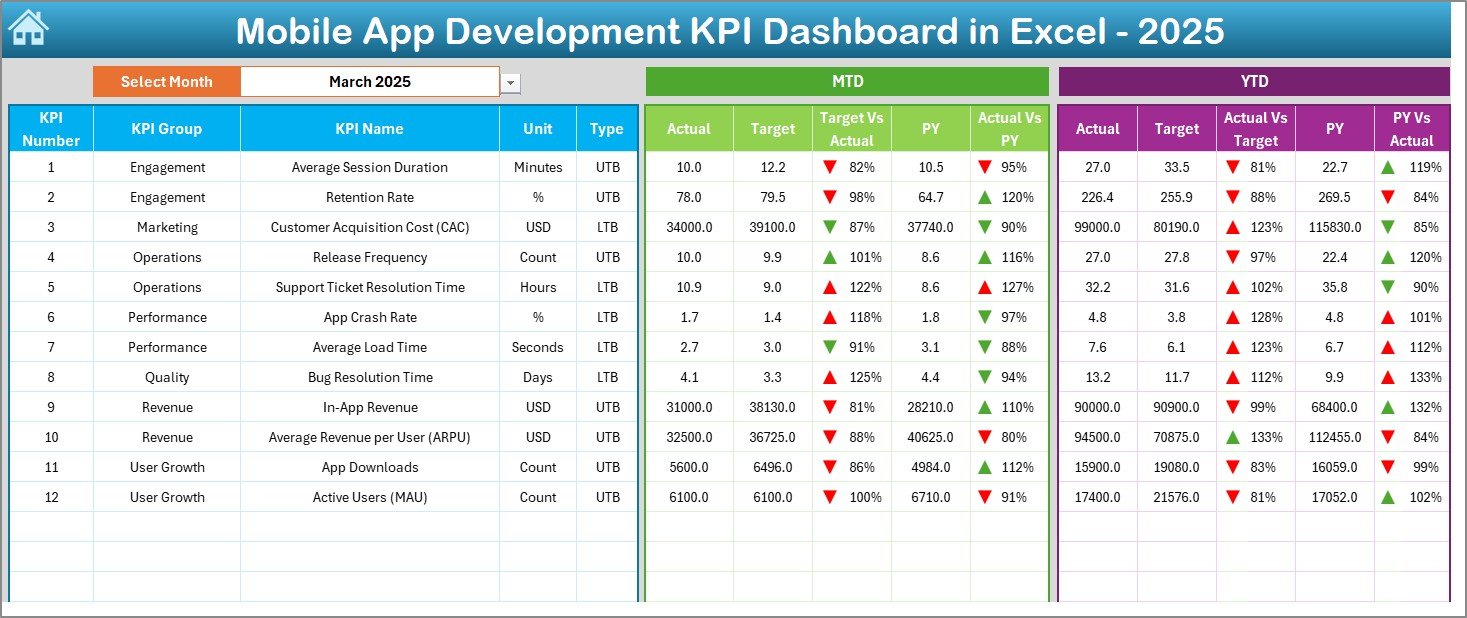
The Dashboard sheet serves as the main reporting page.
Here, you can select the month from the dropdown in cell D3. Once you change the month, the entire dashboard updates automatically.
You can see:
📌 MTD (Month-to-Date) Section
-
Actual values
-
Target values
-
Previous Year values
-
Target vs Actual comparison
-
Previous Year vs Actual comparison
-
Conditional formatting with up/down arrows
📌 YTD (Year-to-Date) Section
-
YTD Actual
-
YTD Target
-
YTD Previous Year
-
Performance comparison indicators
Because of this structure, decision-makers understand performance instantly.
3️⃣ How Does the KPI Trend Sheet Help?
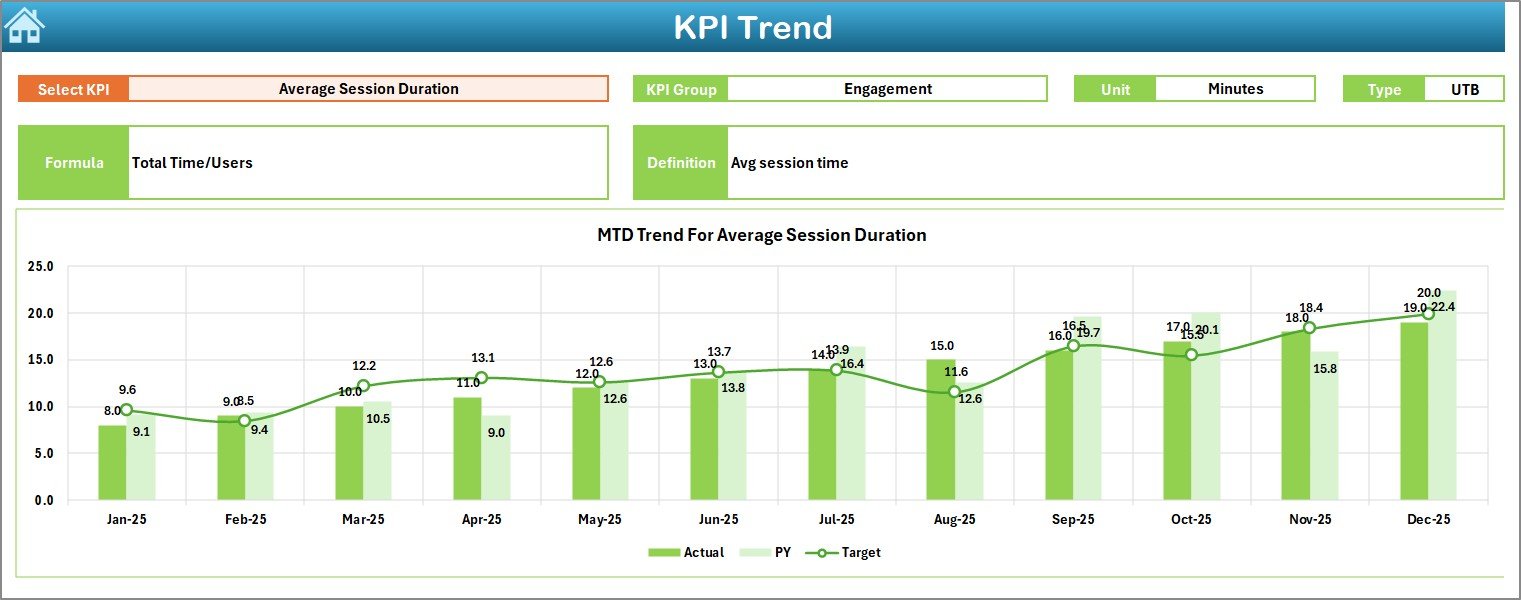
The KPI Trend sheet focuses on detailed analysis.
In cell C3, you can select any KPI from the dropdown.
Then, the sheet displays:
-
KPI Group
-
KPI Unit
-
KPI Type (Lower the Better or Upper the Better)
-
KPI Formula
-
KPI Definition
-
MTD Trend Chart (Actual, Target, Previous Year)
-
YTD Trend Chart
Therefore, you can analyze growth patterns and performance trends easily.
Click to Purchases Mobile App Development KPI Dashboard in Excel
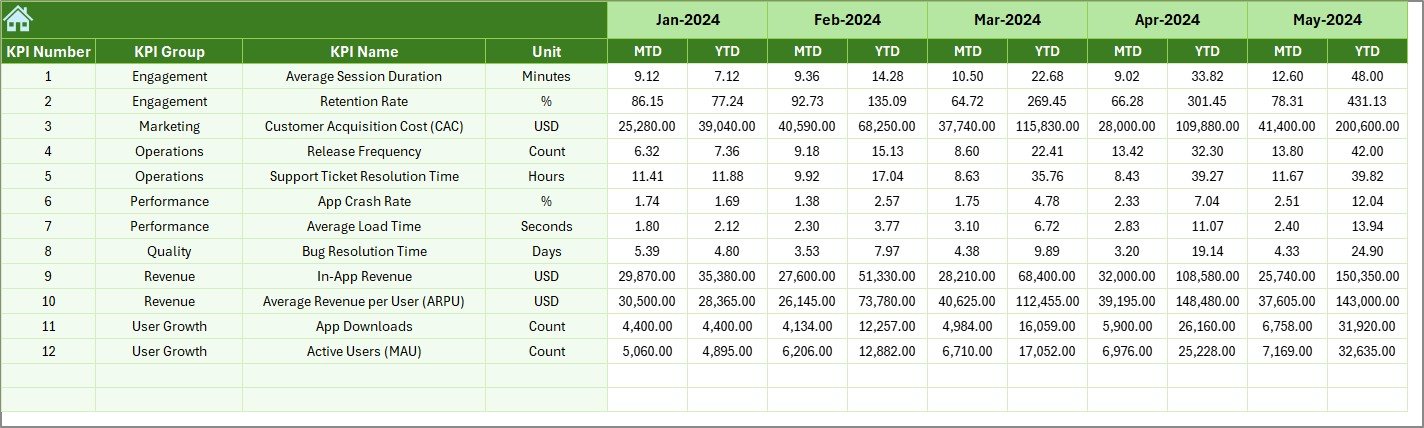
4️⃣ How Does the Actual Numbers Input Sheet Work?
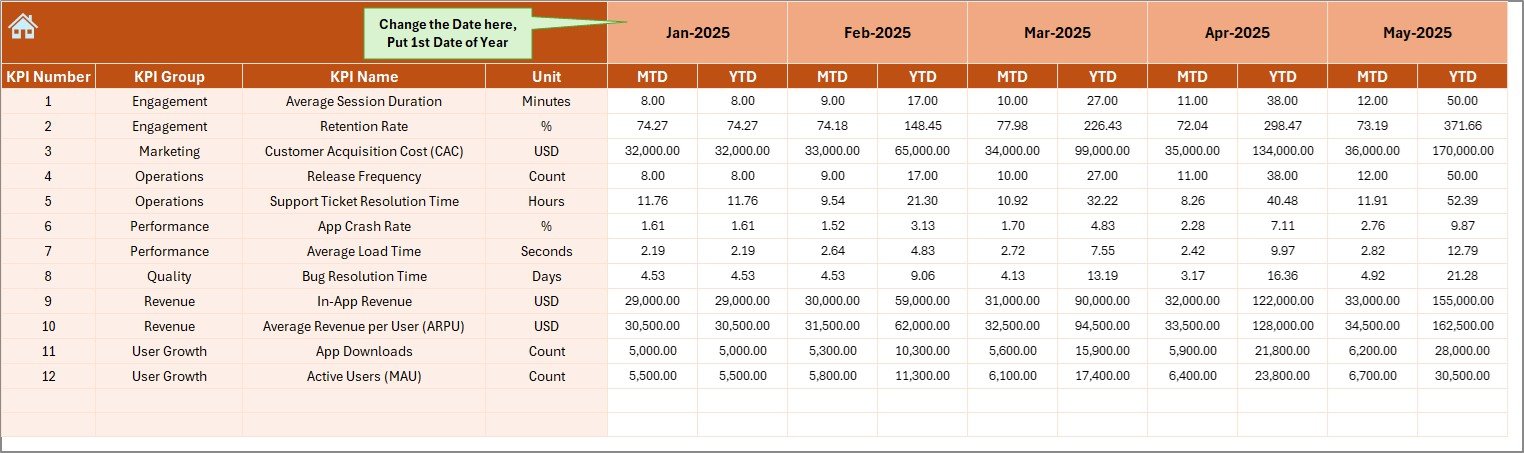
The Actual Numbers Input sheet allows you to enter monthly data.
You only need to:
-
Enter the first month of the year in cell E1
-
Input MTD and YTD actual values
After that, the dashboard updates automatically.
As a result, data entry becomes simple and organized.
5️⃣ What Is the Role of the Target Sheet?
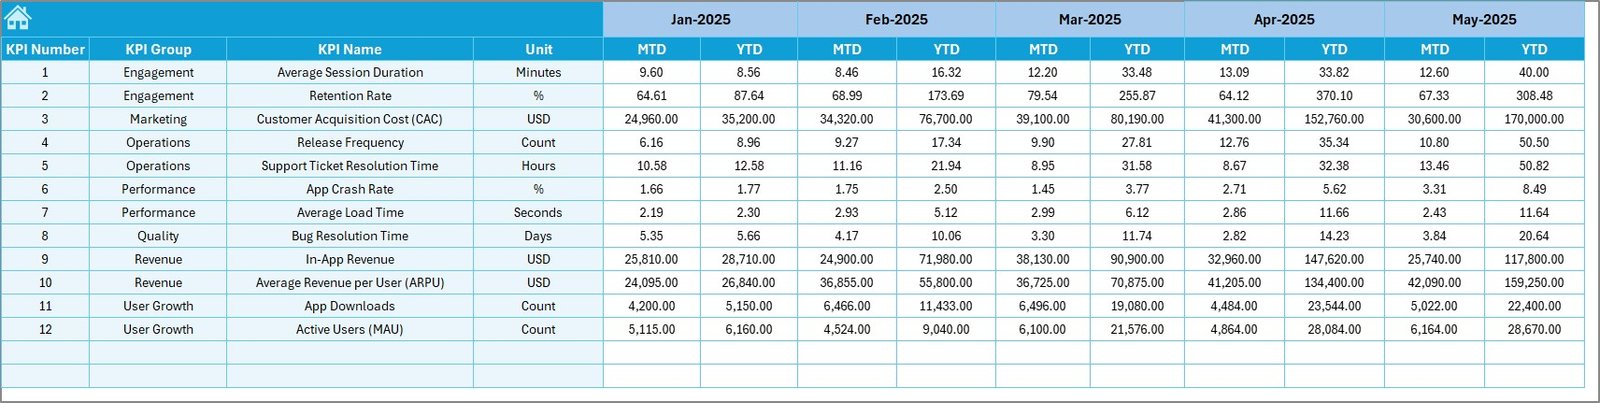
The Target Sheet helps you define expected performance.
Here, you enter:
-
Monthly Target MTD values
-
Monthly Target YTD values
Since targets guide strategy, this sheet ensures accountability.
6️⃣ Why Is the Previous Year Sheet Important?
The Previous Year Number sheet stores last year’s data.
You enter the same format as the current year. Consequently, the dashboard compares:
-
Current Year vs Previous Year
-
Growth trends
-
Performance improvement
Because of historical comparison, you make smarter decisions.
7️⃣ What Does the KPI Definition Sheet Include?
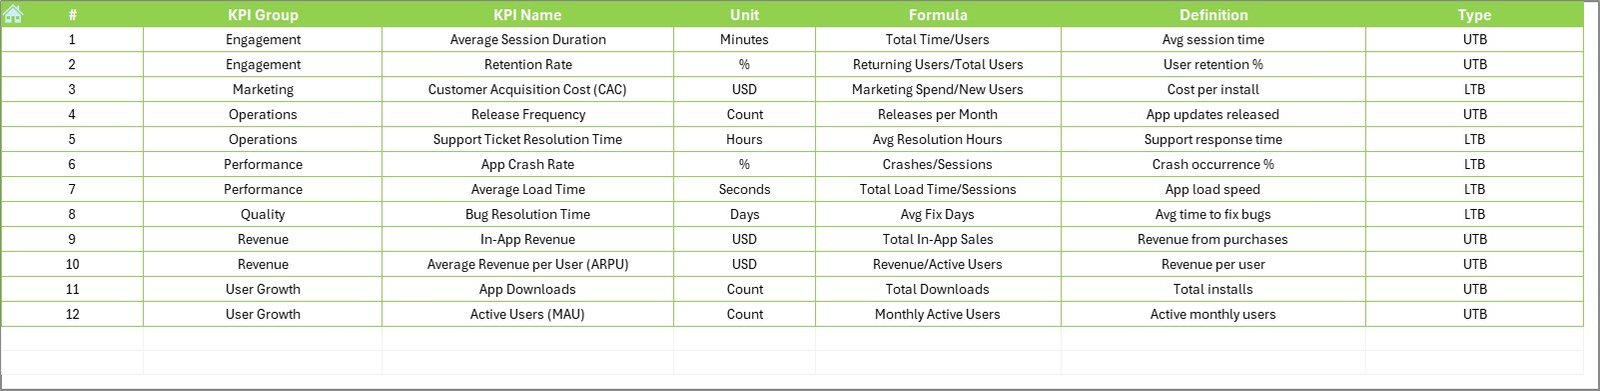
The KPI Definition sheet acts as the reference database.
Here, you define:
-
KPI Name
-
KPI Group
-
KPI Unit
-
KPI Formula
-
KPI Definition
Therefore, everyone understands how each metric works.
What KPIs Should a Mobile App Development Dashboard Track?
A strong Mobile App KPI Dashboard includes metrics from different categories.
📊 Development Performance KPIs
-
Sprint Velocity
-
Feature Completion Rate
-
Release Frequency
-
Cycle Time
🐞 Quality KPIs
-
Bug Resolution Time
-
Defect Density
-
Crash Rate
📱 User Engagement KPIs
-
Daily Active Users (DAU)
-
Monthly Active Users (MAU)
-
User Retention Rate
-
Session Duration
💰 Financial KPIs
-
Customer Acquisition Cost (CAC)
-
Average Revenue Per User (ARPU)
-
App Revenue Growth
-
Conversion Rate
Because you track multiple dimensions, you get a complete performance picture.
How Does This Dashboard Improve Decision Making?
Click to Purchases Mobile App Development KPI Dashboard in Excel
This dashboard improves clarity in several ways.
First, it shows real-time comparisons.
Second, it highlights performance gaps instantly.
Third, it uses conditional formatting for quick understanding.
Finally, it provides trend charts for deeper insights.
As a result, leaders act faster.
Advantages of Mobile App Development KPI Dashboard in Excel
Using this dashboard brings several benefits.
✅ 1. Centralized Performance Monitoring
You manage development, quality, user growth, and finance in one place.
✅ 2. Easy Customization
Excel allows quick changes. Therefore, you can add or remove KPIs easily.
✅ 3. Visual Performance Indicators
Conditional arrows clearly show whether performance improves or declines.
✅ 4. Historical Comparison
You compare current performance with previous year data.
✅ 5. Cost-Effective Solution
You do not need expensive BI tools. Excel handles everything efficiently.
✅ 6. Improved Team Accountability
Targets remain visible. Therefore, teams focus on measurable results.
Best Practices for the Mobile App Development KPI Dashboard
If you want maximum results, follow these best practices.
🔹 1. Define Clear KPIs
Choose KPIs that align with your business goals. Avoid unnecessary metrics.
🔹 2. Update Data Monthly
Enter data consistently. Therefore, trends remain accurate.
🔹 3. Review MTD and YTD Together
MTD shows short-term performance. YTD shows long-term progress.
🔹 4. Analyze Variance Regularly
Check Target vs Actual differences every month.
🔹 5. Involve All Departments
Development, QA, marketing, and finance should review the dashboard together.
🔹 6. Maintain Clean Data Entry
Avoid manual errors. Double-check numbers before finalizing.
How to Implement the Mobile App KPI Dashboard Successfully?
Implementation requires planning.
Step 1: Define Goals
Identify what success means for your app.
Step 2: Select KPIs
Choose metrics that match business priorities.
Step 3: Enter Targets
Define realistic monthly goals.
Step 4: Train the Team
Ensure everyone understands KPI definitions.
Step 5: Conduct Monthly Review Meetings
Use the dashboard as your performance discussion tool.
When you follow these steps, you build a strong performance culture.
Why Choose Excel Instead of Other Tools?
Click to Purchases Mobile App Development KPI Dashboard in Excel
Many tools exist today. However, Excel offers:
-
Easy setup
-
No technical coding requirement
-
Wide accessibility
-
Quick customization
-
Strong formula flexibility
Therefore, small and mid-sized app development teams prefer Excel dashboards.
Conclusion
Mobile app development requires speed, precision, and strategy. However, without proper tracking, teams lose direction.
The Mobile App Development KPI Dashboard in Excel solves this problem. It centralizes performance tracking. It simplifies comparison. It improves accountability. Moreover, it enables faster decision-making.
Because it includes 7 structured worksheets, dynamic month selection, trend charts, and KPI definitions, it offers a complete monitoring solution.
If you want better project control, improved quality, and stronger revenue growth, this dashboard provides the clarity you need.
Now is the time to move from scattered reports to structured insights.
Frequently Asked Questions with Answers
❓ What is a Mobile App Development KPI Dashboard?
A Mobile App Development KPI Dashboard is an Excel-based tool that tracks development, quality, user, and financial performance metrics in one place.
❓ Why should I use Excel for KPI tracking?
Excel offers flexibility, cost efficiency, and easy customization. Therefore, teams can implement it quickly without technical expertise.
❓ How often should I update the dashboard?
You should update the dashboard monthly. However, you can also review weekly if needed.
❓ What does MTD and YTD mean?
MTD means Month-to-Date performance.
YTD means Year-to-Date performance.
❓ Can I add more KPIs to this dashboard?
Yes. You can easily add new KPIs in the KPI Definition sheet and update input sheets accordingly.
❓ Who should use this dashboard?
Product managers, developers, QA leads, marketing managers, and business owners should use this dashboard.
Visit our YouTube channel to learn step-by-step video tutorials