Managing outsourced accounting operations requires constant monitoring of performance, accuracy, deadlines, and productivity. However, many organizations struggle to track accounting performance efficiently because they rely on scattered spreadsheets and manual reports.
Therefore, finance leaders, outsourcing companies, and accounting firms increasingly use KPI dashboards to monitor performance and make better decisions. One powerful solution for this purpose is the Outsourced Accounting KPI Dashboard in Excel.
This dashboard converts complex accounting data into meaningful insights. Moreover, it helps companies measure team productivity, monitor financial service quality, and improve operational efficiency.
In this comprehensive guide, you will learn everything about the Outsourced Accounting KPI Dashboard in Excel, including its features, benefits, KPIs, best practices, and frequently asked questions.
Click to Purchases Outsourced Accounting KPI Dashboard in Excel
What is an Outsourced Accounting KPI Dashboard in Excel?
An Outsourced Accounting KPI Dashboard in Excel is an interactive performance tracking tool designed to measure and monitor accounting service performance delivered by outsourcing teams.
Accounting outsourcing companies manage multiple tasks such as:
-
Accounts payable
-
Accounts receivable
-
Payroll processing
-
Financial reporting
-
Bookkeeping
-
Tax preparation
-
Compliance monitoring
However, without structured tracking, managers cannot easily evaluate performance.
Therefore, the KPI dashboard centralizes all accounting metrics into one Excel-based reporting system. As a result, managers quickly understand how the accounting team performs and identify areas that require improvement.
Moreover, Excel dashboards provide flexibility, automation, and interactive analysis.
Why Do Companies Outsource Accounting Services?
Many businesses outsource accounting functions to specialized firms because it improves efficiency and reduces operational costs.
Several reasons encourage companies to outsource accounting services.
1. Cost Reduction
Companies avoid hiring full-time accounting teams. Instead, they outsource services to reduce salary and infrastructure expenses.
2. Access to Expert Professionals
Outsourcing firms provide experienced accountants who understand industry standards and regulations.
3. Improved Efficiency
Outsourced accounting teams use advanced accounting systems and standardized workflows.
4. Scalability
Businesses can increase or decrease accounting services based on workload.
5. Better Compliance
Professional accounting firms follow regulatory and tax compliance guidelines.
However, once businesses outsource accounting, they must track performance. Therefore, KPI dashboards become essential.
Key Features of the Outsourced Accounting KPI Dashboard in Excel
Click to Purchases Outsourced Accounting KPI Dashboard in Excel
The Outsourced Accounting KPI Dashboard includes several structured worksheets that help track performance effectively.
This ready-to-use Excel template contains 7 powerful worksheets that organize data, calculations, and performance tracking.
Let us explore each worksheet in detail.
1. Home Sheet – Navigation Hub of the Dashboard
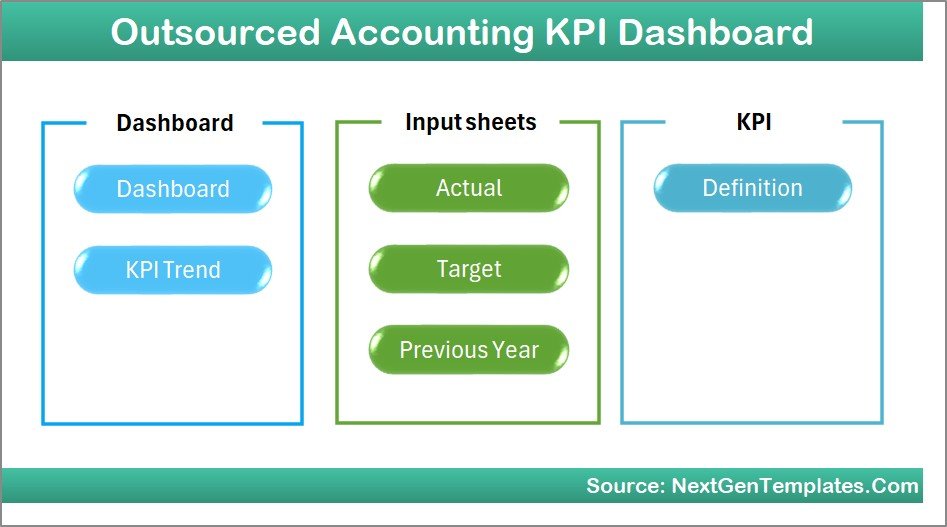
The Home Sheet works as the dashboard index.
It provides a user-friendly interface where users can quickly navigate across different sections of the dashboard.
Key Highlights of the Home Sheet
-
Simple index layout
-
6 navigation buttons
-
One-click navigation to other sheets
-
Easy user experience
Because of this navigation system, users quickly access different dashboard sections without searching through sheets.
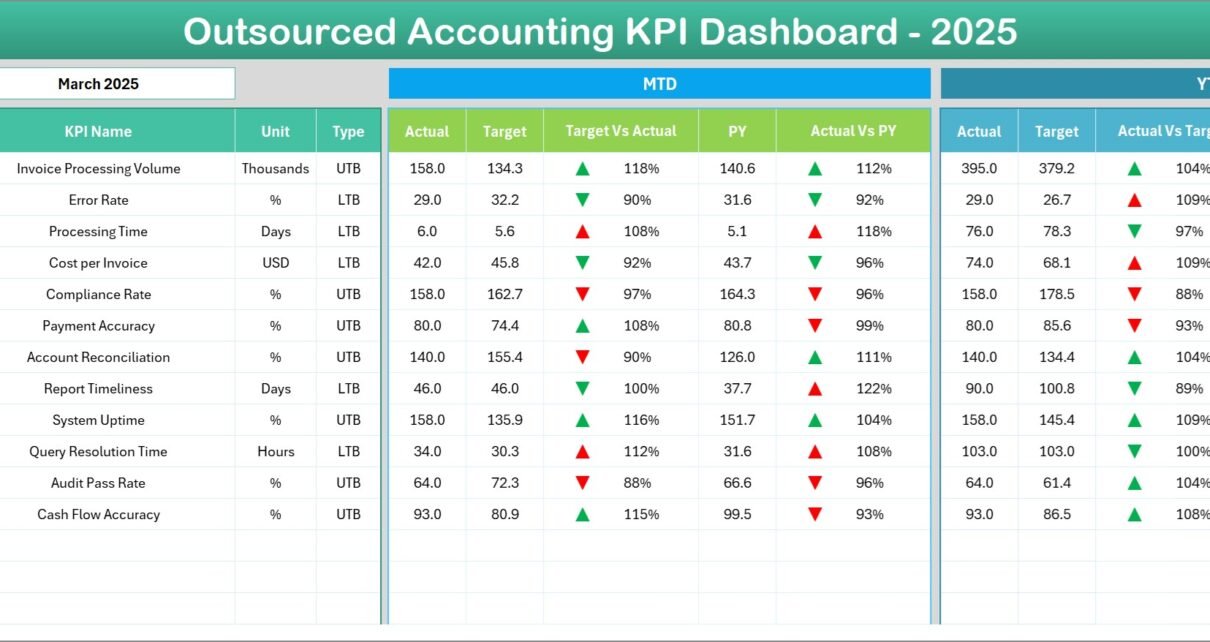
2. Dashboard Sheet – Main KPI Monitoring Page
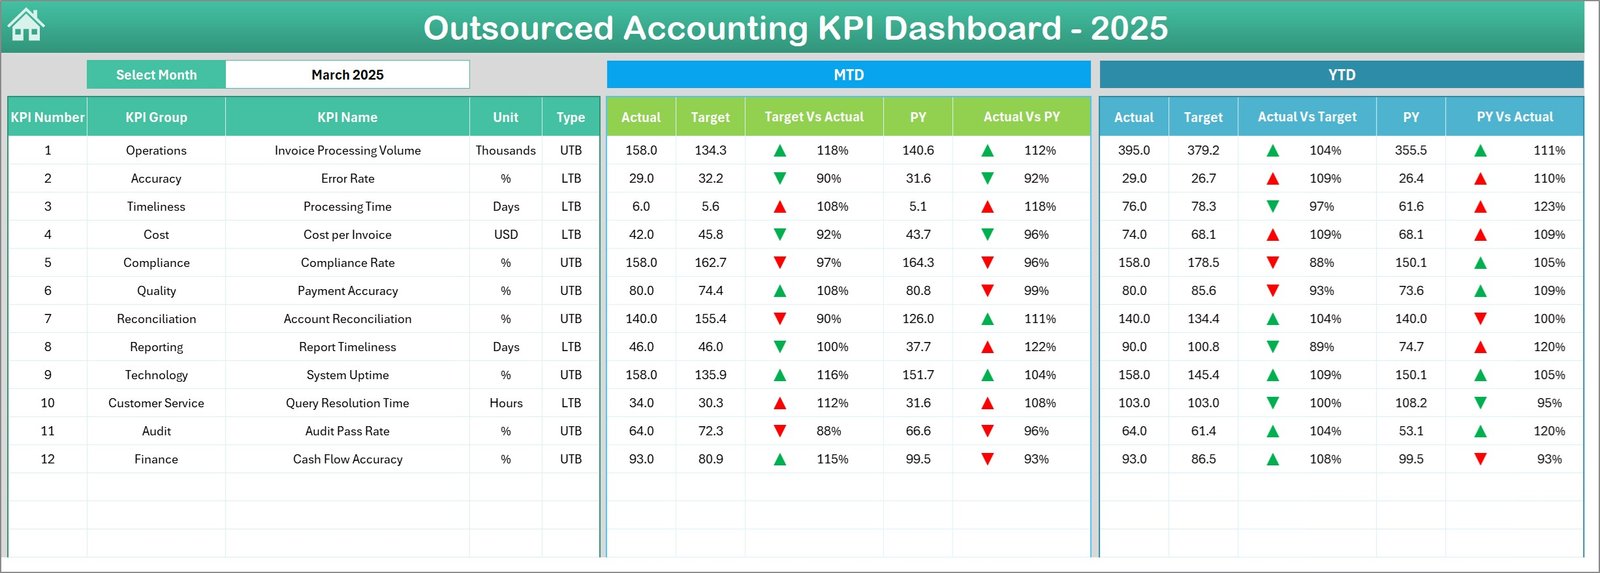
The Dashboard Sheet serves as the core page of the entire KPI tracking system.
Here, users can monitor all outsourced accounting KPIs in one place.
Month Selection Feature
Users can select the Month from the drop-down list in cell D3. Once the month changes, the entire dashboard updates automatically.
Therefore, managers can easily analyze performance month by month.
Key Metrics Displayed on the Dashboard
The dashboard displays two main performance sections:
MTD (Month-to-Date) Metrics
-
Actual performance
-
Target values
-
Previous year numbers
-
Target vs Actual comparison
-
Previous Year vs Actual comparison
YTD (Year-to-Date) Metrics
-
Actual values
-
Target numbers
-
Previous year data
-
Target vs Actual variance
-
Previous Year vs Actual variance
Conditional Formatting Indicators
The dashboard also includes up and down arrows using conditional formatting.
These indicators instantly highlight performance trends:
-
📈 Up Arrow – Performance improvement
-
📉 Down Arrow – Performance decline
Therefore, managers can instantly detect issues and opportunities.
3. KPI Trend Sheet – Performance Trend Analysis
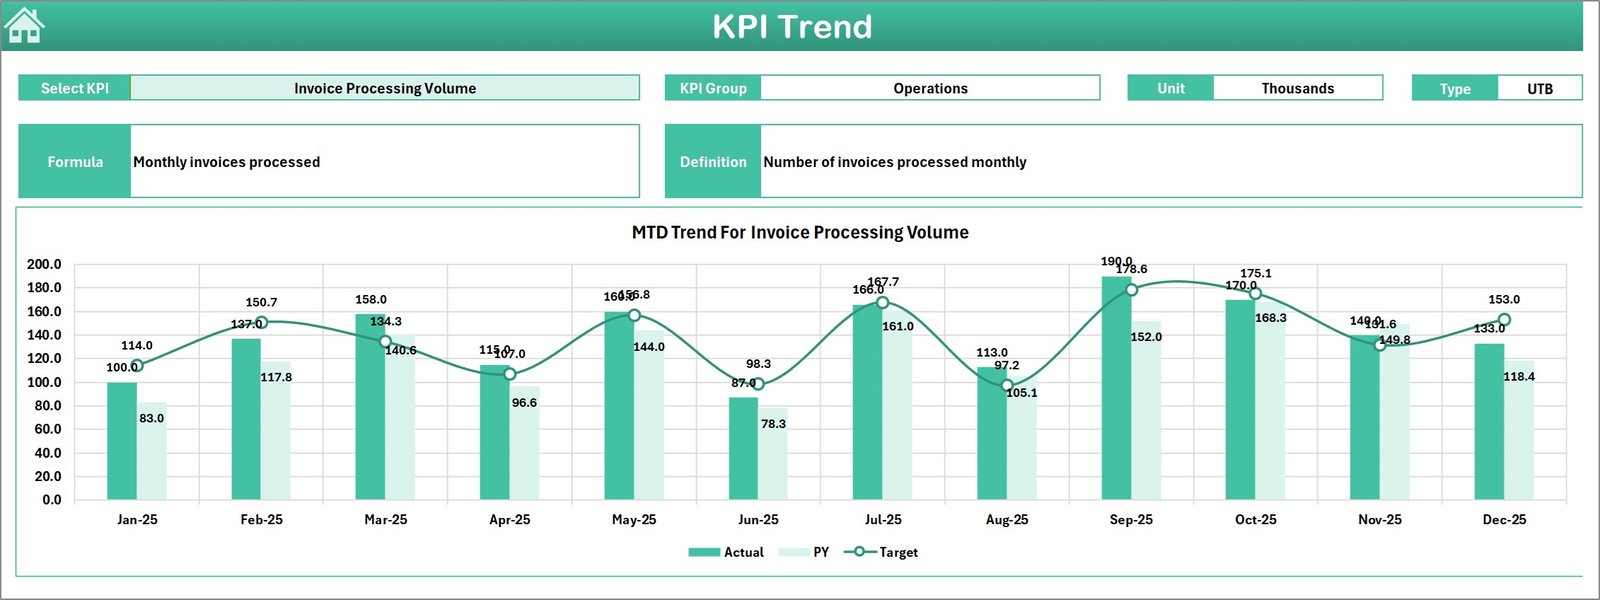
The KPI Trend Sheet helps users analyze the historical trend of any selected KPI.
Users can select the KPI name from the drop-down list in cell C3.
Once the KPI is selected, the dashboard displays detailed KPI information.
Information Displayed in the KPI Trend Sheet
Click to Purchases Outsourced Accounting KPI Dashboard in Excel
-
KPI Group
-
Unit of Measurement
-
KPI Type (Higher is Better / Lower is Better)
-
KPI Formula
-
KPI Definition
KPI Trend Charts
Additionally, this sheet displays two performance charts:
-
MTD Trend Chart
-
YTD Trend Chart
Both charts compare the following values:
-
Actual
-
Target
-
Previous Year
Therefore, managers easily evaluate whether performance improves or declines over time.
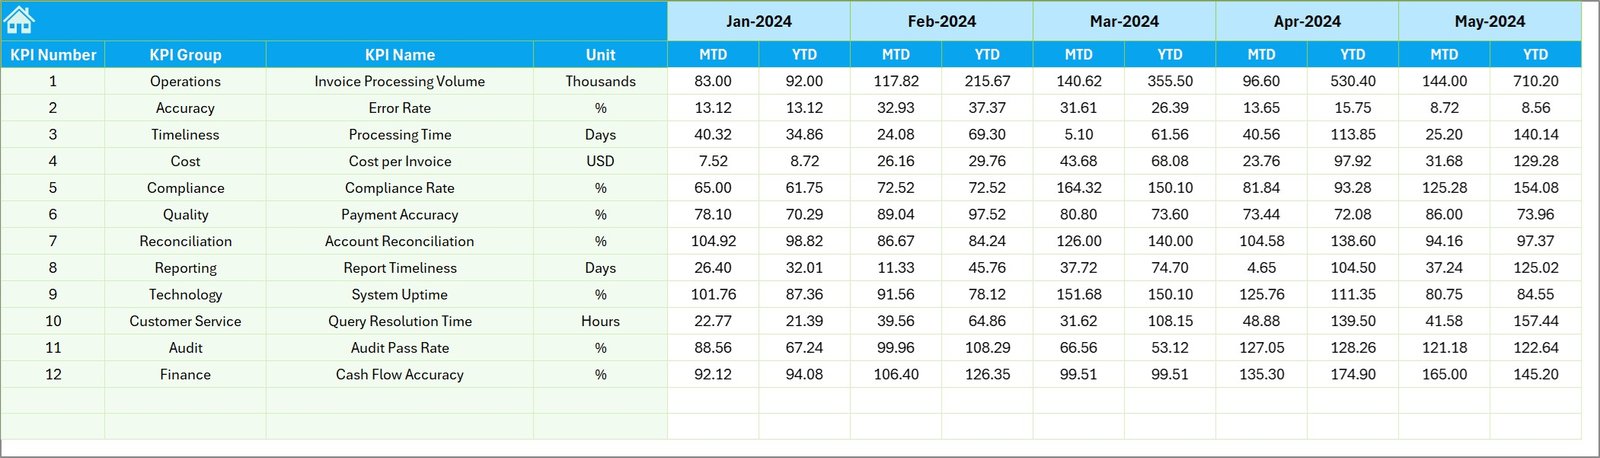
4. Actual Numbers Input Sheet – Enter Current Performance Data
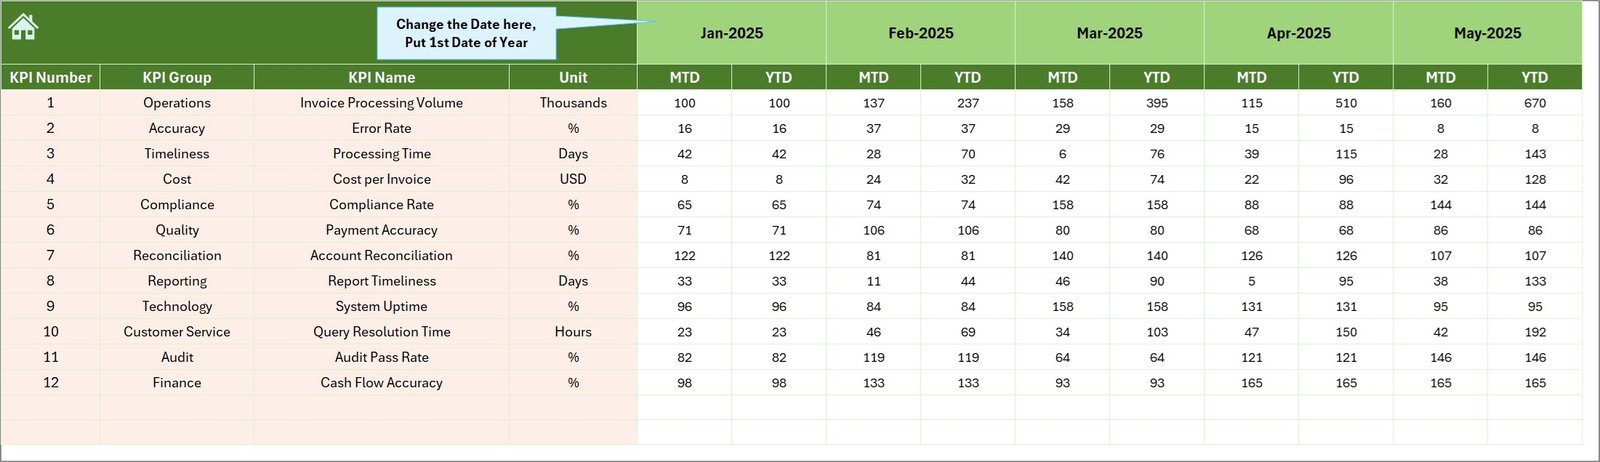
The Actual Numbers Input Sheet stores the real performance numbers for the current year.
This sheet acts as the primary data entry sheet.
Key Input Features
Users enter:
-
Monthly actual values
-
YTD performance values
Month Selection Setup
Users must enter the first month of the year in cell E1.
Once entered, the dashboard automatically tracks subsequent months.
Therefore, data entry remains structured and consistent.
5. Target Sheet – KPI Goal Setting
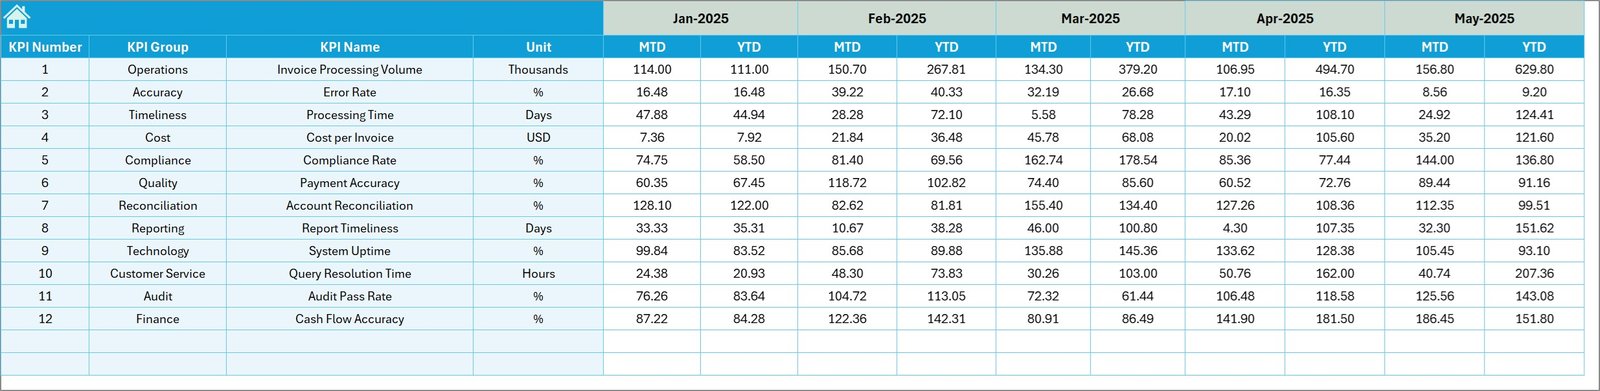
The Target Sheet allows users to define expected performance levels.
Users must enter target values for each KPI.
Target Data Includes
-
Monthly target values
-
Year-to-date targets
Because of this setup, managers can easily compare actual performance against targets.
6. Previous Year Numbers Sheet – Historical Benchmarking
The Previous Year Numbers Sheet stores historical performance data.
Users enter data for the previous year in the same structure used for current year data.
Benefits of Previous Year Comparison
-
Evaluate year-over-year growth
-
Identify performance trends
-
Benchmark improvement
Therefore, this sheet provides important insights for performance evaluation.
Click to Purchases Outsourced Accounting KPI Dashboard in Excel
7. KPI Definition Sheet – KPI Documentation
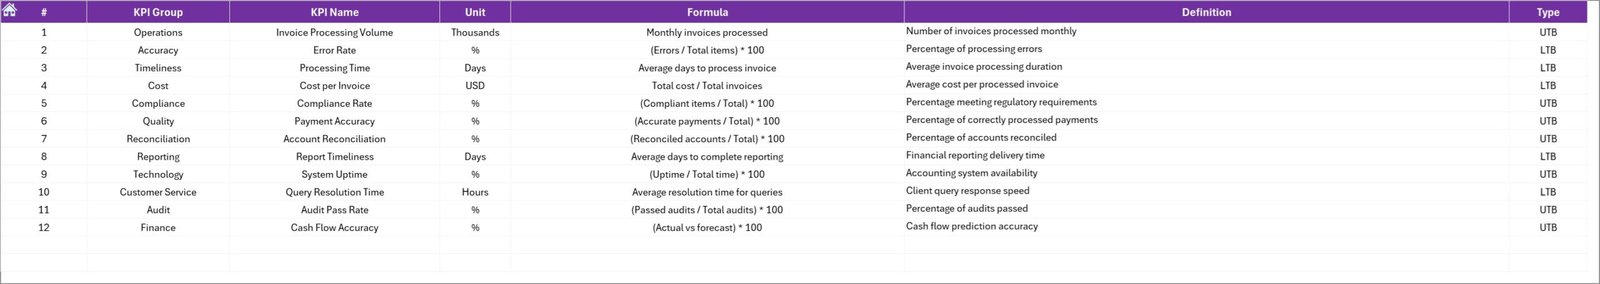
The KPI Definition Sheet works as the knowledge base for the dashboard.
Here, users define all KPIs used in the dashboard.
Information Stored in the KPI Definition Sheet
Each KPI includes the following information:
-
KPI Name
-
KPI Group
-
Unit of Measurement
-
KPI Formula
-
KPI Definition
This documentation ensures that every team member understands the KPI logic.
Important KPIs for Outsourced Accounting Performance
An effective outsourced accounting dashboard tracks several important KPIs.
Here are some commonly used KPIs.
Financial Accuracy KPIs
-
Error Rate
-
Financial Reporting Accuracy
-
Reconciliation Accuracy
Productivity KPIs
-
Invoices Processed per Employee
-
Transactions Processed per Day
-
Accounting Tasks Completed
Efficiency KPIs
-
Average Processing Time
-
Invoice Processing Cycle Time
-
Payroll Processing Time
Compliance KPIs
-
Compliance Rate
-
Audit Findings
-
Regulatory Compliance Score
Service Quality KPIs
-
Client Satisfaction Score
-
SLA Compliance Rate
-
Issue Resolution Time
These KPIs help organizations measure service quality effectively.
Advantages of Outsourced Accounting KPI Dashboard in Excel
Using a KPI dashboard provides several strategic benefits.
1. Centralized Performance Monitoring
Managers view all accounting KPIs in one dashboard.
Therefore, decision-making becomes easier.
2. Better Financial Visibility
The dashboard provides clear insights into accounting operations.
Consequently, managers quickly identify performance issues.
3. Faster Decision Making
Because the dashboard shows real-time metrics, leaders can make faster operational decisions.
4. Improved Accountability
Each KPI measures specific performance areas.
Therefore, teams remain accountable for results.
5. Easy Data Analysis
Excel dashboards provide charts, comparisons, and trends.
Thus, users can analyze data without advanced tools.
6. Budget-Friendly Analytics
Excel dashboards cost significantly less than enterprise BI tools.
Therefore, small businesses can easily adopt them.
How Does the Dashboard Improve Accounting Outsourcing Performance?
Click to Purchases Outsourced Accounting KPI Dashboard in Excel
Outsourcing companies manage multiple clients and financial transactions. However, performance management becomes difficult without structured analytics.
The KPI dashboard solves this challenge.
Performance Tracking
Managers track team performance across multiple accounting functions.
SLA Monitoring
The dashboard tracks service-level agreements for clients.
Productivity Analysis
Managers evaluate employee productivity using KPI comparisons.
Financial Accuracy Monitoring
The dashboard highlights errors and compliance issues.
As a result, companies improve service quality and client satisfaction.
Best Practices for the Outsourced Accounting KPI Dashboard
Organizations should follow several best practices while using KPI dashboards.
1. Define Clear KPIs
Select KPIs that directly align with accounting goals.
Avoid unnecessary metrics.
2. Maintain Data Accuracy
Accurate data ensures reliable insights.
Therefore, teams must verify input data regularly.
3. Update Data Regularly
Update dashboard data monthly or weekly.
Regular updates ensure meaningful insights.
4. Focus on Actionable Insights
Managers should focus on insights that drive improvement.
Avoid overloading the dashboard with too many metrics.
5. Use Visual Indicators
Charts, arrows, and color coding make analysis easier.
Therefore, dashboards should remain visually clear.
6. Train the Accounting Team
Teams must understand the meaning of each KPI.
Training improves dashboard adoption.
Who Can Use the Outsourced Accounting KPI Dashboard?
Several professionals can benefit from this dashboard.
Accounting Firms
Accounting outsourcing companies track team productivity and service performance.
Finance Managers
Finance managers monitor accounting efficiency and reporting accuracy.
Business Owners
Business owners evaluate outsourced accounting service quality.
CFOs
Chief Financial Officers use dashboards for financial decision-making.
Financial Analysts
Analysts use KPI dashboards to analyze operational trends.
Conclusion
The Outsourced Accounting KPI Dashboard in Excel provides a powerful solution for monitoring accounting performance and operational efficiency.
It centralizes important KPIs, tracks performance trends, and simplifies decision-making. Moreover, it enables finance teams to monitor productivity, measure service quality, and ensure compliance.
Because Excel provides flexibility and automation, companies can easily implement this dashboard without expensive software.
Therefore, organizations that outsource accounting services should adopt KPI dashboards to improve transparency, accountability, and operational efficiency.
Frequently Asked Questions (FAQs)
1. What is an Outsourced Accounting KPI Dashboard?
An Outsourced Accounting KPI Dashboard is a performance tracking system that measures accounting outsourcing service performance using key performance indicators.
2. Why should companies track accounting KPIs?
Companies track KPIs to monitor productivity, ensure financial accuracy, improve compliance, and measure outsourcing performance.
3. Can Excel handle KPI dashboards effectively?
Yes. Excel supports formulas, pivot tables, charts, and automation features that make KPI dashboards very powerful.
4. What KPIs are most important in outsourced accounting?
Important KPIs include:
-
Error rate
-
Invoice processing time
-
SLA compliance
-
Client satisfaction
-
Transaction accuracy
5. How often should KPI dashboards be updated?
Click to Purchases Outsourced Accounting KPI Dashboard in Excel
Organizations should update KPI dashboards monthly or weekly depending on reporting requirements.
6. Who benefits from this dashboard?
Finance managers, CFOs, accounting firms, business owners, and financial analysts benefit from outsourced accounting KPI dashboards.
Visit our YouTube channel to learn step-by-step video tutorials