Modern manufacturing plants rely heavily on automation units, robotic machines, and intelligent production systems. These technologies increase productivity, improve product quality, and reduce operational errors. However, organizations must monitor automation equipment carefully to ensure smooth operations.
Unfortunately, many companies still rely on scattered spreadsheets or manual reports to track machine performance. As a result, managers struggle to analyze downtime, maintenance costs, or operating efficiency across departments.
Click to Purchases Automation Units Dashboard in Power BI
Therefore, businesses increasingly adopt data-driven dashboards to manage automation systems. One powerful solution is the Automation Units Dashboard in Power BI.
The Automation Units Dashboard in Power BI provides a centralized analytics platform where managers can monitor machine performance, maintenance activities, downtime trends, and energy consumption. Because Power BI offers interactive visualization and real-time analysis, decision-makers gain clear insights into operational performance.
In this article, you will learn everything about the Automation Units Dashboard in Power BI, including its features, components, advantages, best practices, and frequently asked questions.
What is an Automation Units Dashboard in Power BI?
An Automation Units Dashboard in Power BI is an interactive reporting tool that helps organizations monitor the performance of automated equipment across factories, departments, vendors, and locations.
This dashboard collects operational data from multiple sources such as:
-
Machine operating hours
-
Downtime records
-
Maintenance logs
-
Energy consumption data
-
Vendor service details
Power BI then transforms this data into interactive charts, KPIs, and visual insights. Managers can analyze equipment performance, detect problems quickly, and make better operational decisions.
Because Power BI supports automation and real-time analytics, organizations can easily monitor their automation systems without relying on complex manual reporting.
Why Do Organizations Need an Automation Units Dashboard?
Automation systems play a critical role in modern production environments. However, machines require regular monitoring and maintenance.
Without a structured monitoring system, organizations may face several problems.
Common Challenges Without an Automation Dashboard
-
Difficulty tracking machine downtime
-
Lack of visibility into maintenance costs
-
Poor monitoring of operating hours
-
Inefficient vendor management
-
Uncontrolled energy consumption
-
Delayed decision-making
Therefore, organizations use Power BI dashboards to transform raw machine data into actionable insights.
When managers can clearly see performance metrics, they improve operational efficiency and reduce equipment failures.
Key Features of the Automation Units Dashboard in Power BI
Click to Purchases Automation Units Dashboard in Power BI
The Automation Units Dashboard in Power BI contains five powerful analytical pages. Each page focuses on a different operational perspective.
These interactive pages help managers monitor automation performance from multiple angles.
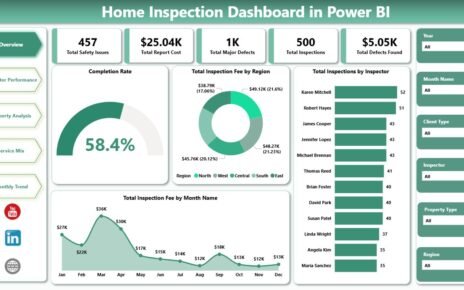
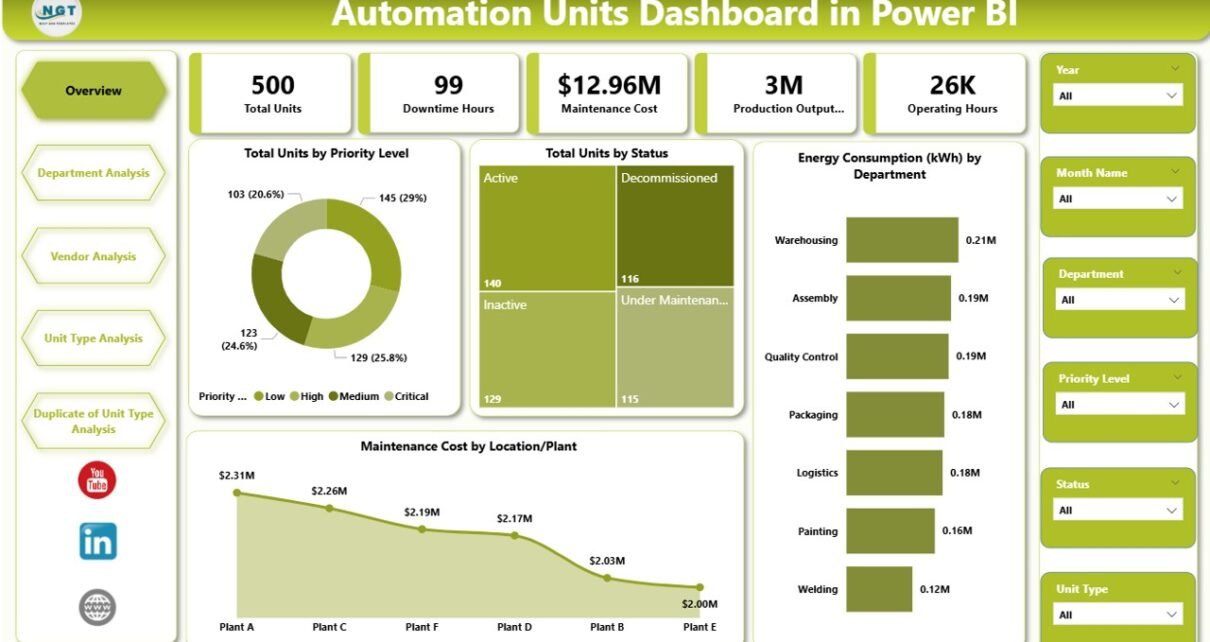
1. Overview Page
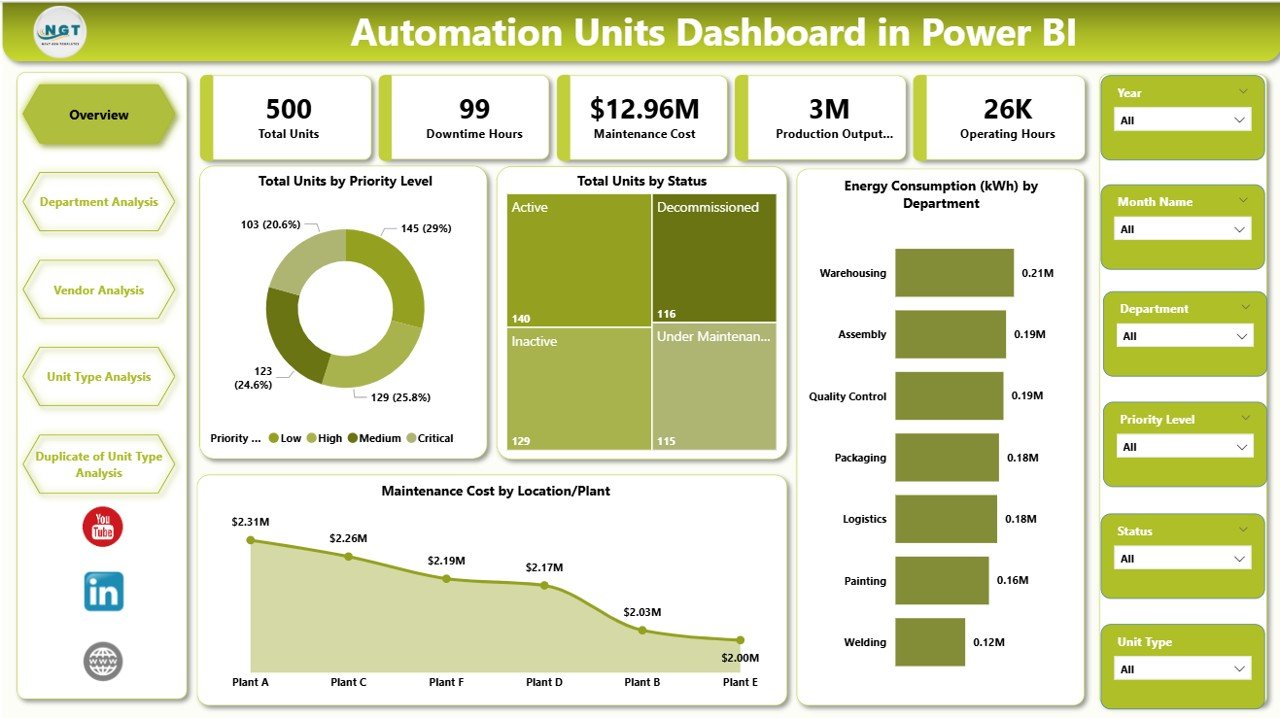
The Overview Page acts as the central control panel of the dashboard. It provides a quick snapshot of automation unit performance.
This page contains slicers that allow users to filter the dashboard by different parameters.
Key Elements of the Overview Page
KPI Cards
The dashboard displays five important KPI cards, such as:
-
Total Units by Priority Level
-
Total Units by Status
-
Energy Consumption by Department
-
Maintenance Cost by Location or Plant
These KPI indicators help managers quickly understand the overall status of automation systems.
Analytical Charts
The Overview Page also displays charts that summarize operational performance. Managers can immediately identify which departments consume the most energy or which plants generate higher maintenance costs.
Because the overview page provides quick insights, decision-makers can immediately detect operational problems.
2. Department Analysis Page
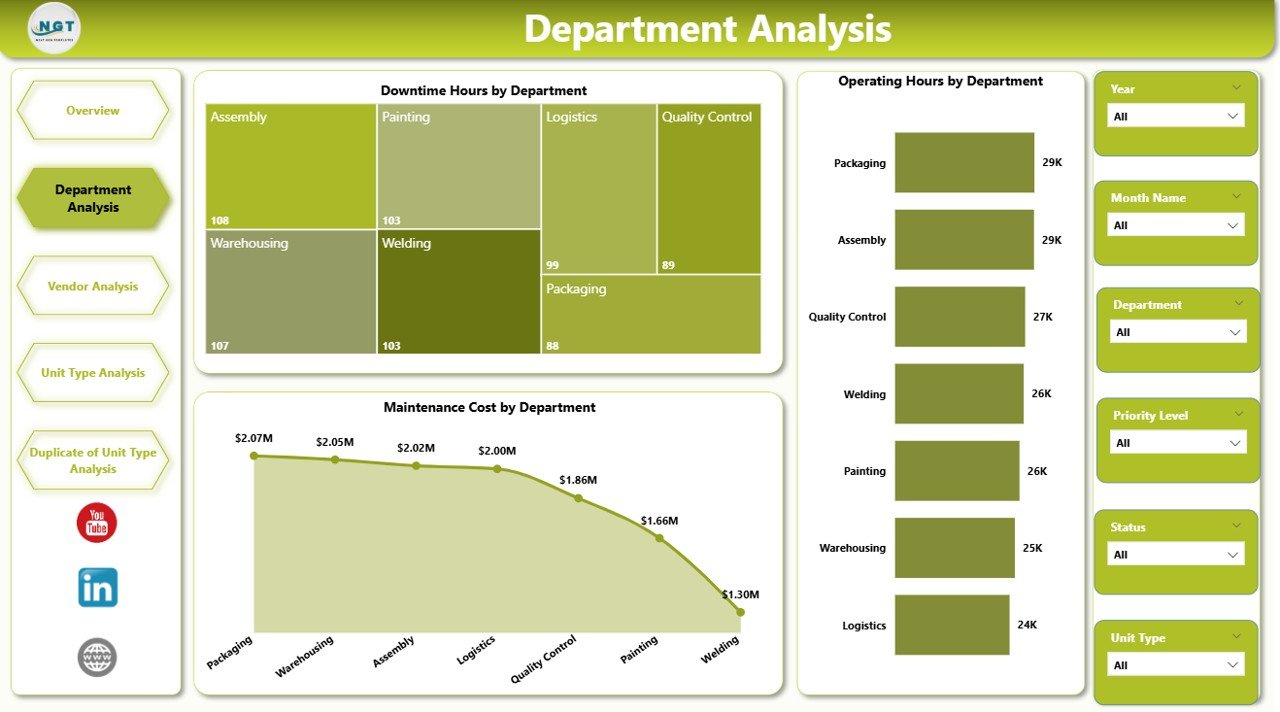
The Department Analysis Page focuses on automation performance at the departmental level.
Factories often operate multiple departments such as assembly, packaging, quality control, or logistics. Each department may use different automation units.
Therefore, analyzing departmental performance becomes critical.
Charts Available in Department Analysis
This page includes three key visualizations:
-
Downtime Hours by Department
-
Operating Hours by Department
-
Maintenance Cost by Department
These charts help managers answer important questions.
For example:
-
Which department experiences the most machine downtime?
-
Which department uses automation units the longest?
-
Which department generates higher maintenance expenses?
As a result, management can allocate maintenance resources more effectively.
Click to Purchases Automation Units Dashboard in Power BI
3. Vendor Analysis Page
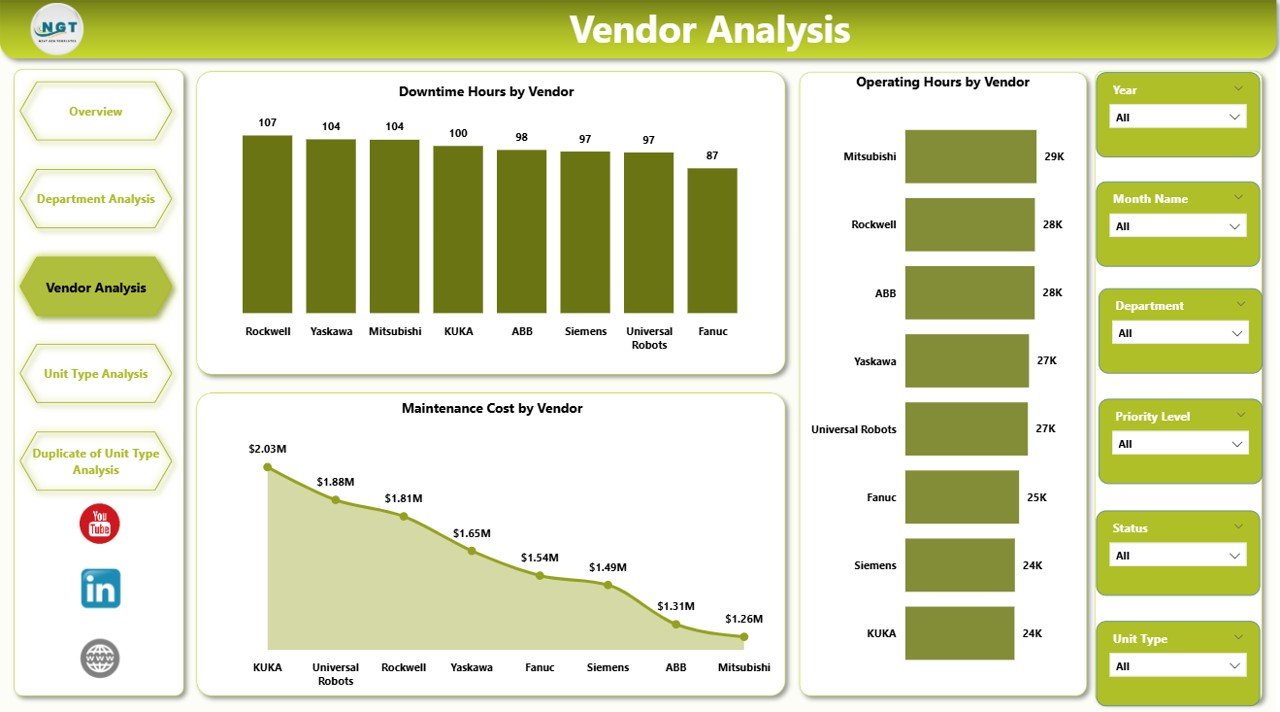
Automation equipment often requires support from external vendors. These vendors provide machine installation, servicing, spare parts, and maintenance support.
However, organizations must monitor vendor performance carefully.
The Vendor Analysis Page provides insights into vendor-related operational data.
Charts Available in Vendor Analysis
The dashboard includes the following charts:
-
Total Downtime Hours by Vendor
-
Operating Hours by Vendor
-
Maintenance Cost by Vendor
These insights help managers evaluate vendor performance.
For instance:
-
Vendors with higher downtime may indicate poor service quality.
-
Vendors with high maintenance costs may require contract review.
Therefore, organizations can optimize vendor relationships and reduce operational risks.
4. Unit Type Analysis Page
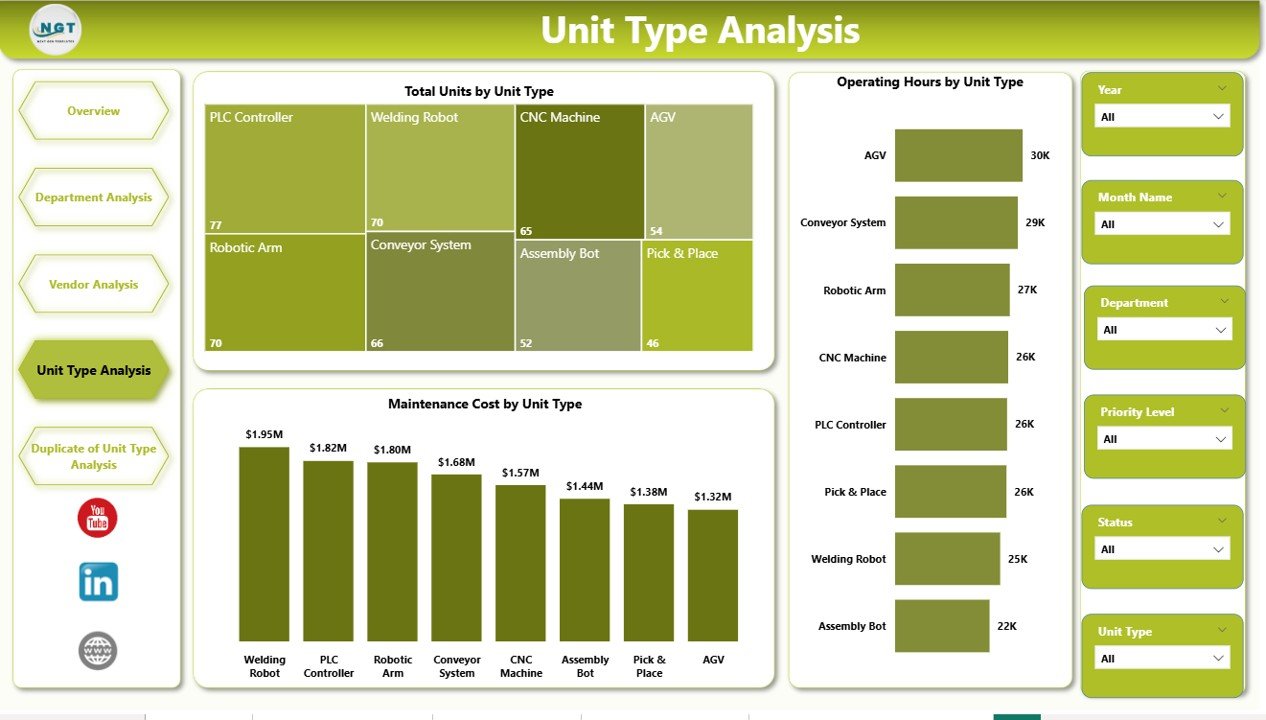
Manufacturing plants use different types of automation units such as:
-
Robotic arms
-
Packaging machines
-
Conveyor systems
-
Assembly robots
-
Sorting machines
Each automation type operates under different conditions.
Therefore, analyzing machine performance by unit type becomes essential.
Charts in Unit Type Analysis
The dashboard includes three main charts:
-
Total Units by Unit Type
-
Operating Hours by Unit Type
-
Maintenance Cost by Unit Type
These charts allow managers to understand:
-
Which machine types operate the most
-
Which automation units require frequent maintenance
-
Which equipment generates higher operational costs
As a result, companies can plan machine upgrades or replacements more effectively.
5. Month Analysis Page
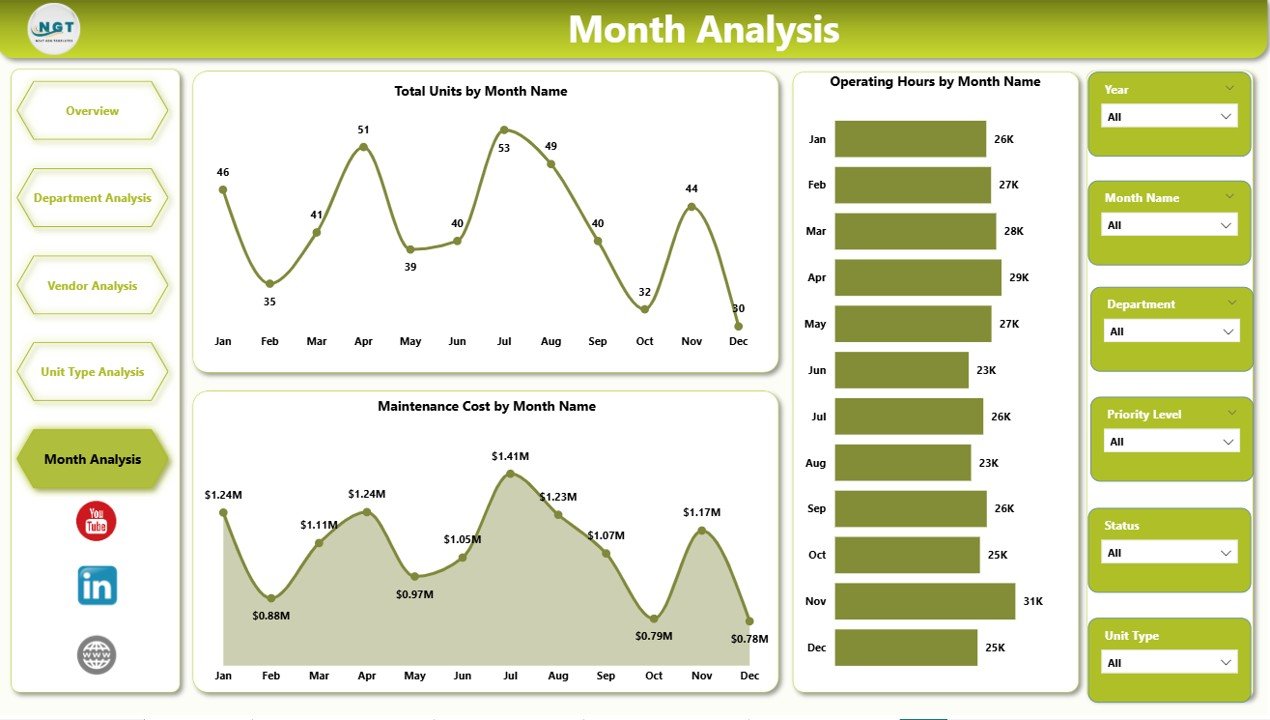
Automation performance often changes over time. Therefore, monthly analysis becomes essential for identifying operational trends.
The Month Analysis Page allows managers to monitor machine performance month by month.
Charts Included in Month Analysis
This page displays the following metrics:
-
Total Units by Month
-
Operating Hours by Month
-
Maintenance Cost by Month
Managers can easily track seasonal changes in equipment usage.
For example:
-
Higher production months may increase machine usage.
-
Maintenance costs may increase during heavy production periods.
Therefore, organizations can plan maintenance schedules proactively.
Click to Purchases Automation Units Dashboard in Power BI
Advantages of Automation Units Dashboard in Power BI
Organizations gain several benefits when they implement the Automation Units Dashboard in Power BI.
1. Centralized Performance Monitoring
Managers can view all automation performance metrics in one place. Instead of reviewing multiple reports, they can analyze everything in a single dashboard.
2. Real-Time Operational Insights
Power BI updates data automatically. Therefore, managers receive the latest information about machine performance.
3. Improved Maintenance Planning
The dashboard highlights downtime trends and maintenance costs. As a result, maintenance teams can schedule repairs more efficiently.
4. Better Vendor Management
The vendor analysis page allows organizations to compare vendor performance and service quality.
5. Data-Driven Decision Making
Interactive charts and KPI indicators provide clear insights. Consequently, managers can make better operational decisions.
6. Increased Equipment Efficiency
When organizations monitor machine performance regularly, they identify inefficiencies quickly.
7. Reduced Operational Costs
Early detection of machine problems prevents major breakdowns and reduces repair costs.
Best Practices for the Automation Units Dashboard in Power BI
Organizations should follow several best practices to maximize the value of automation dashboards.
Maintain Accurate Data Sources
Ensure that machine data comes from reliable sources such as:
-
IoT sensors
-
Maintenance systems
-
production logs
Accurate data improves dashboard reliability.
Standardize Performance Metrics
Define clear KPIs for automation performance such as:
-
downtime hours
-
operating hours
-
maintenance cost
-
energy consumption
Standardized metrics improve consistency across reports.
Use Automated Data Refresh
Schedule automatic data refresh in Power BI to ensure real-time insights.
Train Employees on Dashboard Usage
Provide proper training for managers and operators so they can use the dashboard effectively.
Monitor KPIs Regularly
Review dashboard insights frequently to detect operational problems early.
Optimize Visualization Design
Use simple charts, filters, and clear KPI cards to improve dashboard readability.
Who Can Benefit from the Automation Units Dashboard?
Many professionals and organizations can benefit from automation dashboards.
Manufacturing Managers
They monitor equipment performance and optimize production efficiency.
Maintenance Teams
They track machine failures, downtime trends, and maintenance schedules.
Plant Operations Managers
They analyze department-level performance and operational costs.
Vendor Management Teams
They evaluate vendor service performance and contract effectiveness.
Business Executives
They gain strategic insights into automation investments and operational efficiency.
How Does Power BI Improve Automation Monitoring?
Power BI offers powerful features that improve automation monitoring.
Interactive Visualizations
Users can explore data through interactive charts and filters.
Data Integration
Power BI connects with multiple systems such as:
-
Excel
-
SQL databases
-
IoT platforms
-
ERP systems
Real-Time Analytics
Managers can track machine performance in real time.
Automated Reporting
Power BI automatically updates dashboards without manual work.
Future Trends in Automation Monitoring
Automation technology continues to evolve rapidly.
Organizations now integrate automation dashboards with advanced technologies such as:
Industrial IoT
Sensors collect machine data automatically.
Predictive Maintenance
AI predicts machine failures before they occur.
Smart Manufacturing
Connected machines communicate with each other to improve efficiency.
AI-Powered Analytics
Artificial intelligence helps organizations detect patterns and optimize operations.
Therefore, automation dashboards will become even more powerful in the future.
Click to Purchases Automation Units Dashboard in Power BI
Conclusion
Automation systems play a critical role in modern manufacturing environments. However, organizations must monitor machine performance carefully to maintain operational efficiency.
The Automation Units Dashboard in Power BI provides a powerful solution for monitoring automation equipment. It transforms complex operational data into clear visual insights.
Because the dashboard includes multiple analytical pages such as Overview, Department Analysis, Vendor Analysis, Unit Type Analysis, and Month Analysis, managers gain a complete view of automation performance.
As a result, organizations can reduce downtime, control maintenance costs, improve vendor management, and increase equipment efficiency.
Companies that adopt data-driven dashboards gain a strong competitive advantage in today’s smart manufacturing environment.
Frequently Asked Questions (FAQs)
What is an Automation Units Dashboard in Power BI?
An Automation Units Dashboard in Power BI is an interactive analytics tool that helps organizations monitor machine performance, maintenance costs, downtime hours, and energy consumption.
Why should companies use automation dashboards?
Companies use automation dashboards to monitor equipment performance, reduce downtime, improve maintenance planning, and make data-driven decisions.
What data is required for an automation dashboard?
Typical data sources include:
-
machine operating hours
-
downtime logs
-
maintenance records
-
energy consumption
-
vendor service data
Can Power BI connect to automation systems?
Yes. Power BI can connect to multiple systems including IoT platforms, ERP systems, databases, and Excel files.
Visit our YouTube channel to learn step-by-step video tutorials