Introduction
The Blood Banks Dashboard in Excel is a comprehensive, ready-to-use solution designed to simplify and enhance blood bank data management and analysis. By updating the data in the dedicated Data sheet and refreshing the workbook, users can instantly view an insightful, dynamic dashboard that helps track important metrics across blood banks, regions, and time.
Click to buy Blood Banks Dashboard in Excel
Key Features of Blood Banks Dashboard in Excel
- Easy data updates through a dedicated Data sheet.
- Dynamic refresh feature enabling instant updates across all dashboards.
- Multiple dashboard pages focusing on different analysis aspects.
- Interactive slicers for quick filtering and customized views.
- Insightful cards highlighting key performance indicators.
- Comprehensive charts showcasing trends, cost, revenue, and inventory metrics.
Dashboard Pages Explanation
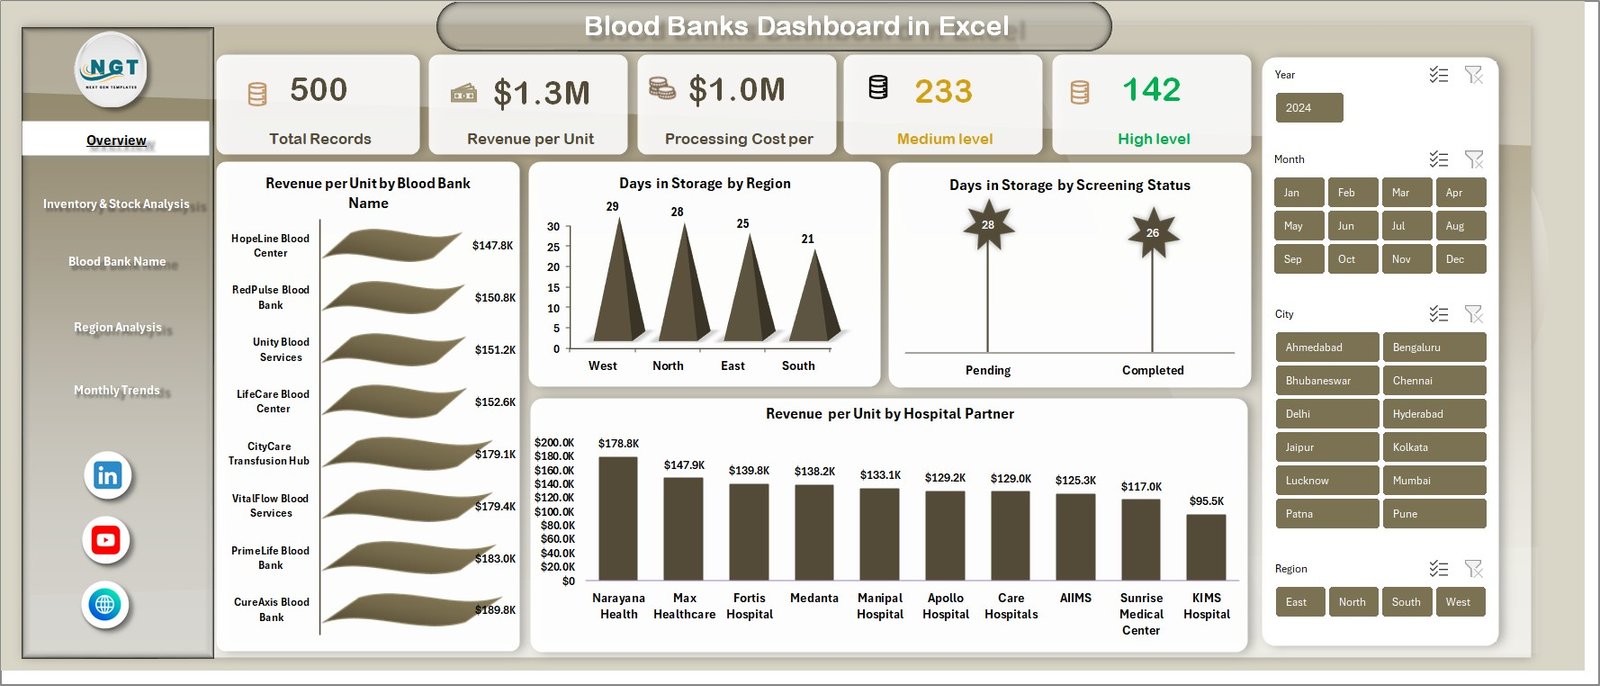
1. Overview Page
This page provides a high-level snapshot of the data. At the top, intuitive cards display crucial metrics:
- Total Records: The total number of blood units recorded.
- Revenue per Unit: Average revenue generated per blood unit.
- Processing Cost per Unit: Average processing cost incurred for each blood unit.
- Medium Level & High Level: Counts or percentages indicating blood units at medium and high urgency or quality levels.
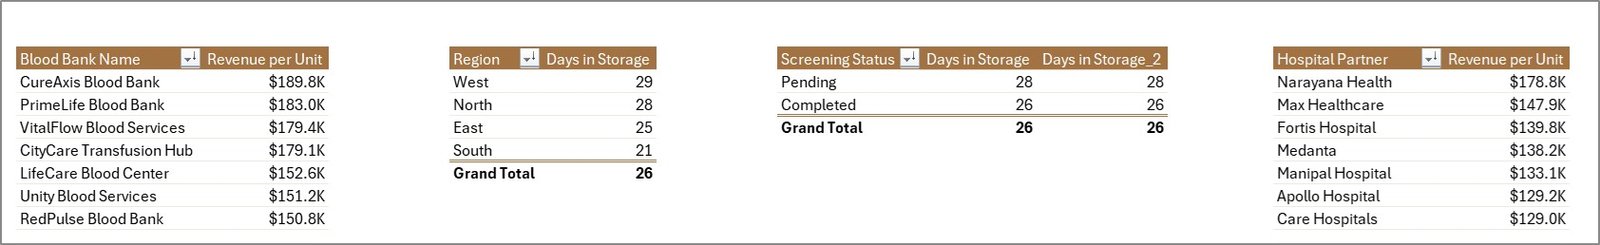
The following charts allow deeper insights:
- Revenue per Unit by Blood Bank Name: Displays revenue variations across different blood banks.
- Days in Storage by Region: Tracks the average number of days blood units remain stored in various regions.
- Days in Storage by Screening Status: Breaks down storage duration based on screening outcomes.
- Revenue per Unit by Hospital Partner: Highlights revenue performance tied to hospital collaborations.
Click to buy Blood Banks Dashboard in Excel
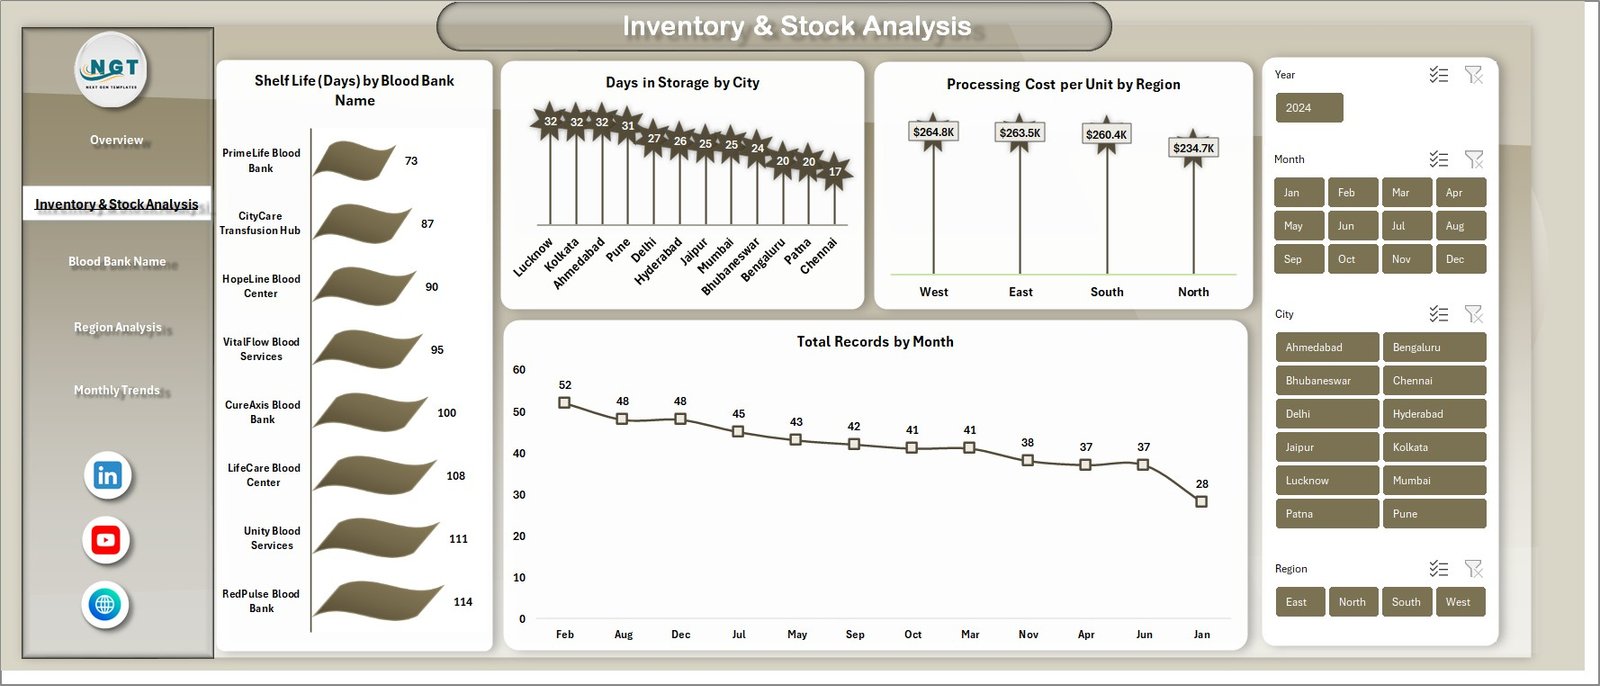
2. Inventory & Stock Analysis
This sheet provides detailed inventory insights via multiple analyses:
- Shelf Life (Days) by Blood Bank Name: Measures blood unit longevity by individual blood banks.
- Days in Storage by City: Shows storage duration trends across different cities.
- Processing Cost per Unit by Region: Compares processing costs region-wise to identify cost efficiencies.
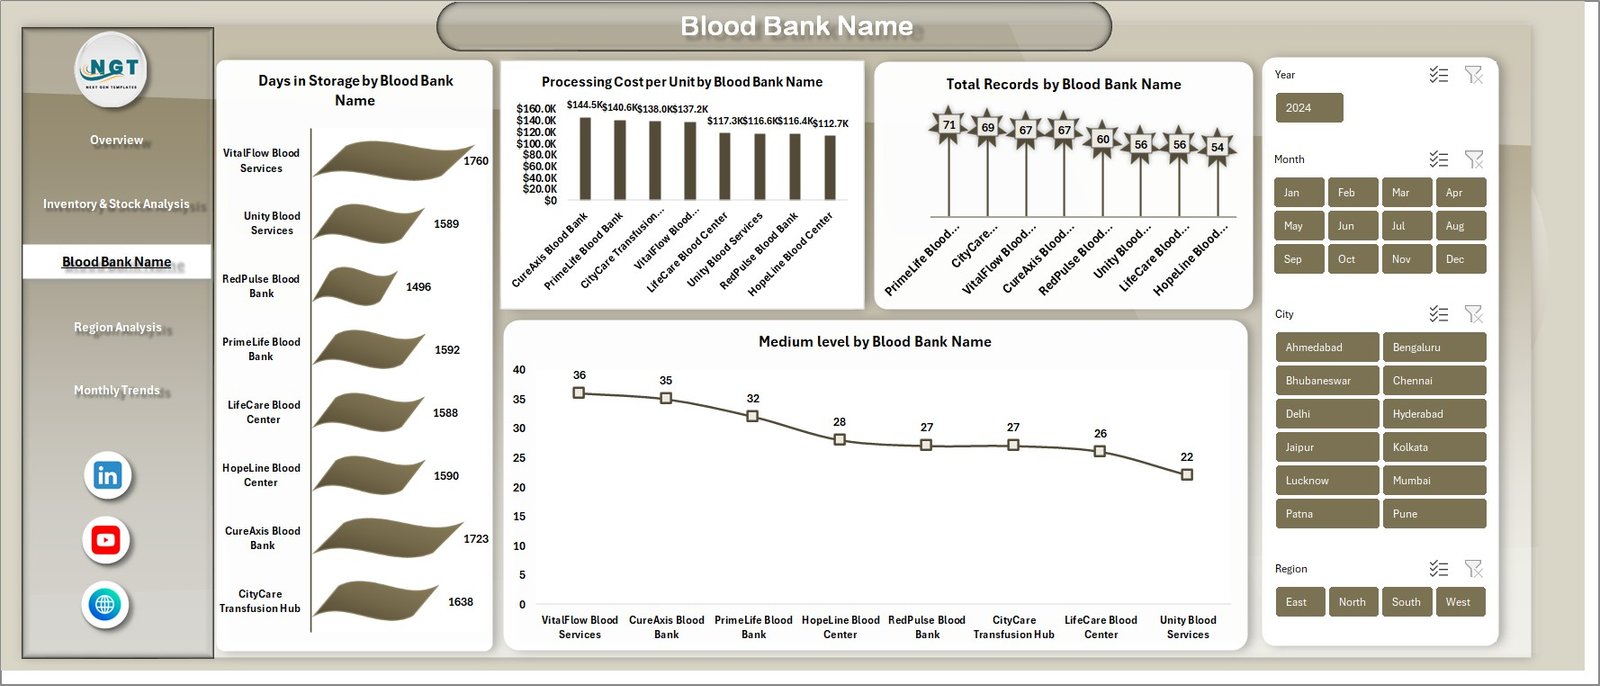
3. Blood Bank Name
This tab zooms in on individual blood banks by showing:
- Days in Storage by Blood Bank Name: Detailed storage time analysis.
- Processing Cost per Unit by Blood Bank Name: Cost efficiency per bank is tracked here.
- Total Records by Blood Bank Name: Volume of blood units managed per bank.
- Medium Level by Blood Bank Name: Displays medium-level quality or urgency indicators.
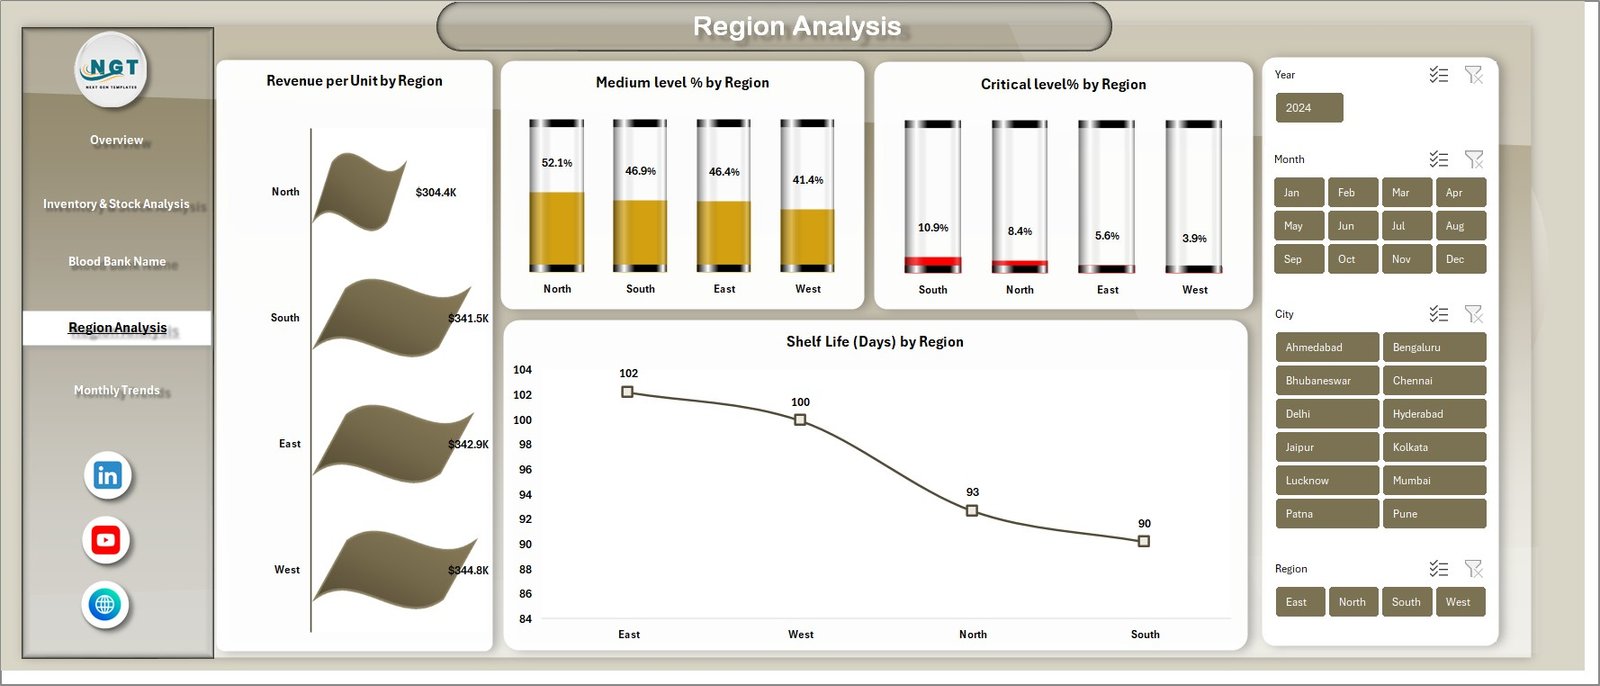
4. Region Analysis
This section breaks down data by region, helping identify regional trends and performance with charts including:
- Revenue per Unit by Region: Regional revenue comparisons.
- Medium Level % by Region: Percentage of medium urgency or medium quality units per region.
- Critical Level % by Region: Percentage indicating high urgency/critical units region-wise.
- Shelf Life (Days) by Region: Shelf life performance comparisons across regions.
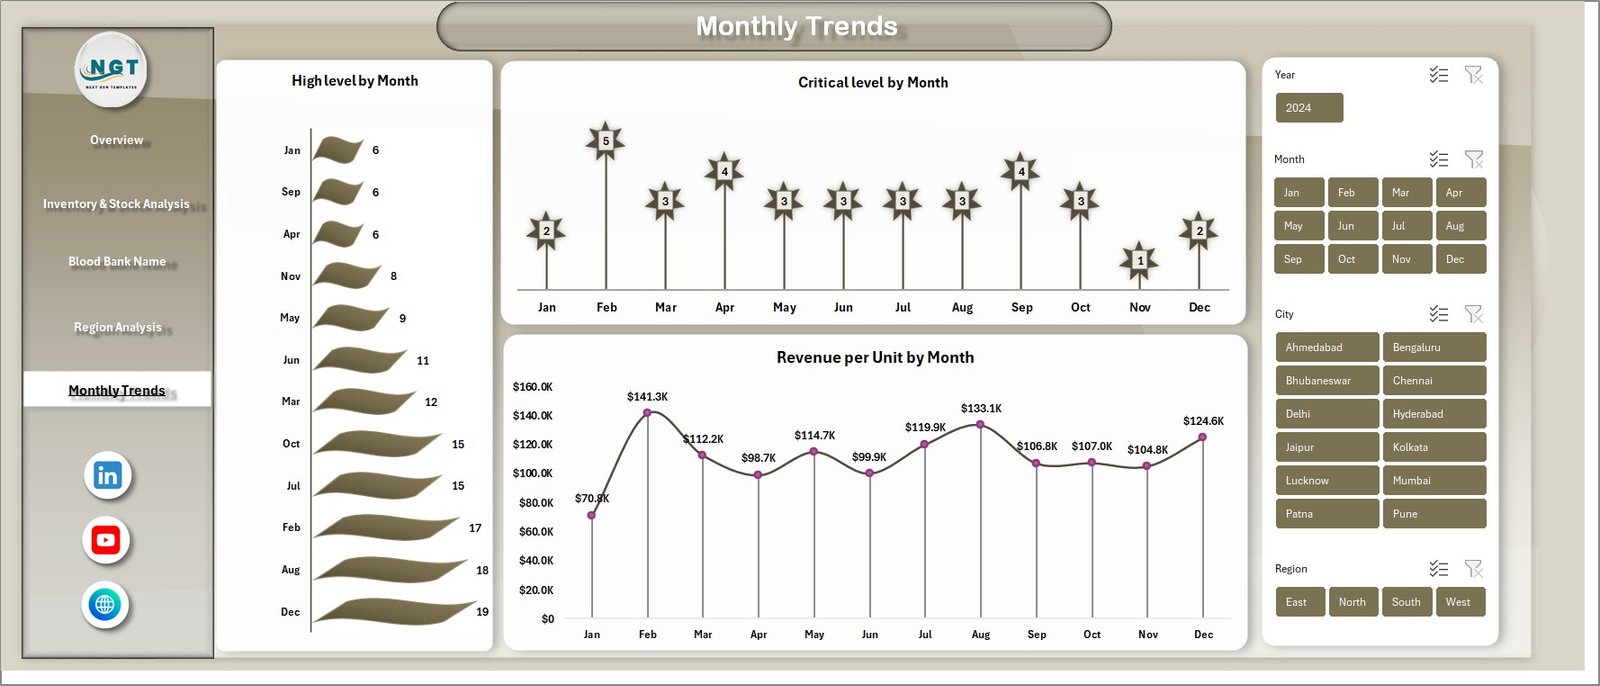
5. Monthly Trends
This page highlights temporal trends to understand fluctuations and seasonal effects with charts for:
- Total Records by Month: Monthly volume tracking.
- High Level by Month: Number of high urgency or quality level units each month.
- Critical Level by Month: Count of critical-level units monthly.
- Revenue per Unit by Month: Revenue performance month over month.
6. Data Sheet Tab
The Data Sheet is the backend data repository where user inputs are added in a structured format. All dashboard visuals dynamically reflect changes made here upon refresh.

7. Support Sheet
The Support Sheet hosts multiple pivot tables essential for powering the dynamic dashboard. After updating data, simply press ‘Refresh All’ under the Data tab on the Excel ribbon to update all pivots and charts. This sheet is best kept hidden to maintain dashboard cleanliness.
Advantages of Blood Banks Dashboard in Excel
- User-Friendly Interface: Slicers and cards make filtering and exploring data simple.
- Dynamic Updates: One-click refresh to update all visuals after data changes.
- Comprehensive Analysis: Multiple pages provide well-rounded insights into key metrics.
- Customizable: Easily adaptable for specific blood bank or hospital reporting needs.
- Cost-Effective: Enabled on Excel, avoiding high-cost software implementations.
Opportunities for Improvement
- Integrate real-time data connections for automatic updates without manual data entry.
- Add automated alerts for critical shelf life breaches or revenue drops.
- Include predictive analytics for forecasting blood demand and inventory needs.
- Incorporate user access controls to protect sensitive data within the workbook.
- Expand compatibility with mobile Excel versions for remote access.
Best Practices
- Always backup your data sheet before making bulk changes.
- Refresh all pivot tables using the Data > Refresh All button to keep dashboards current.
- Use slicers systematically to drill down into specific parameters.
- Keep the Support Sheet hidden to avoid accidental tampering with pivot tables.
- Regularly review dashboard visualizations to ensure data integrity.
FAQs
Can I customize the dashboard charts?
Yes, the charts are based on pivot tables and can be adjusted or enhanced to fit your specific data requirements.
How do I refresh the dashboard after updating data?
Go to the Data tab in Excel’s ribbon and click ‘Refresh All’ to update all pivot tables and charts instantly.
Is this dashboard suitable for all blood banks?
The dashboard is designed to be flexible for most blood banks but may require minor customization depending on specific operations or reporting needs.
Can I share this dashboard with colleagues?
Yes, but ensure data privacy guidelines are maintained, and consider protecting sensitive sheets if necessary.
Conclusion
The Blood Banks Dashboard in Excel provides a powerful, easy-to-use platform for monitoring blood bank operations efficiently. Its multi-dimensional views and dynamic refresh capabilities enable users to make informed decisions backed by data insights. With ongoing updates and best practice usage, this dashboard can greatly enhance blood bank management performance.
For more tips and demo videos on dynamic Excel dashboards, visit our YouTube channel.
For further Microsoft Excel resources, check out the official Microsoft Excel Support page.
Watch the step-by-step video tutorial:
Visit our YouTube channel to learn step-by-step video tutorials