Agricultural exports play a major role in the global economy. Countries export large volumes of agricultural products such as grains, fruits, vegetables, spices, and processed food to international markets every year. Agro export companies constantly manage shipments, export costs, product categories, destinations, and profits across different regions.
However, managing export data through traditional spreadsheets or manual reports often creates confusion. Many companies struggle to track export performance, analyze shipment costs, evaluate product demand, and monitor profitability across global markets.
Therefore, organizations need a smart and structured analytics solution to transform raw export data into meaningful insights.
Click to Purchases Agro Export Companies Dashboard in Excel
This is exactly where the Agro Export Companies Dashboard in Excel becomes extremely useful.
The Agro Export Companies Dashboard in Excel is a ready-to-use analytical solution that helps export companies monitor shipments, evaluate export costs, analyze product performance, and track profits across regions and countries.
Because Excel offers powerful tools such as Pivot Tables, Pivot Charts, slicers, formulas, and interactive visuals, users can quickly convert complex export data into clear and interactive dashboards.
In this comprehensive guide, we will explore everything about the Agro Export Companies Dashboard in Excel, including its features, structure, advantages, best practices, and how export businesses can use it to improve their decision-making.
What is an Agro Export Companies Dashboard in Excel?
An Agro Export Companies Dashboard in Excel is a data visualization and reporting tool designed to analyze agricultural export operations in an organized and interactive format.
Instead of reviewing multiple spreadsheets and reports, decision-makers can view all important export metrics in one place.
The dashboard helps businesses monitor:
-
Export value
-
Shipment costs
-
Profit by region
-
Product category performance
-
Export company activity
-
Destination country performance
-
Monthly export trends
Because the dashboard displays the information visually, managers can identify trends, risks, and opportunities much faster.
As a result, companies can make smarter decisions about logistics, pricing, and market expansion.
Why Do Agro Export Companies Need a Dashboard?
Agro export operations generate huge volumes of data every day. Export managers must track shipment modes, export costs, profits, product categories, and regional demand.
Without a centralized reporting system, organizations face many problems.
Common Challenges in Agro Export Management
-
Scattered export data across multiple files
-
Difficulty tracking export profitability
-
Lack of visibility into shipment costs
-
Poor monitoring of export regions and destinations
-
Time-consuming manual reporting
-
Difficulty analyzing product category performance
However, an Excel dashboard solves these challenges effectively.
Because it converts raw data into visual insights, companies can easily understand their export performance and improve operational efficiency.
Key Features of the Agro Export Companies Dashboard in Excel
The Agro Export Companies Dashboard contains several interactive features that make export data analysis easier and more efficient.
Page Navigator
The Page Navigator appears on the left side of the dashboard.
This feature allows users to move easily between different analytical pages of the dashboard.
Instead of scrolling through multiple sheets, users can quickly jump to the required analysis page.
This improves usability and saves time.
Dashboard Structure: Pages Included in the Excel Dashboard
The Agro Export Companies Dashboard contains five analytical pages in the Excel desktop application.
Each page focuses on a specific area of export performance.
Click to Purchases Agro Export Companies Dashboard in Excel
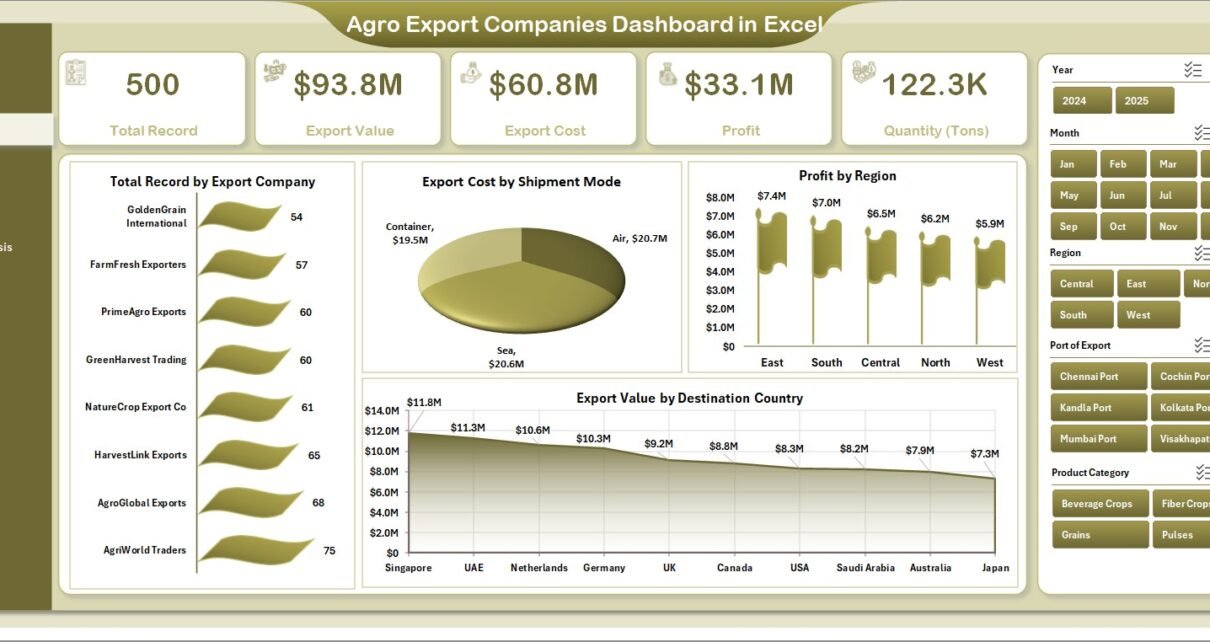
1. Overview Page – Export Performance Summary
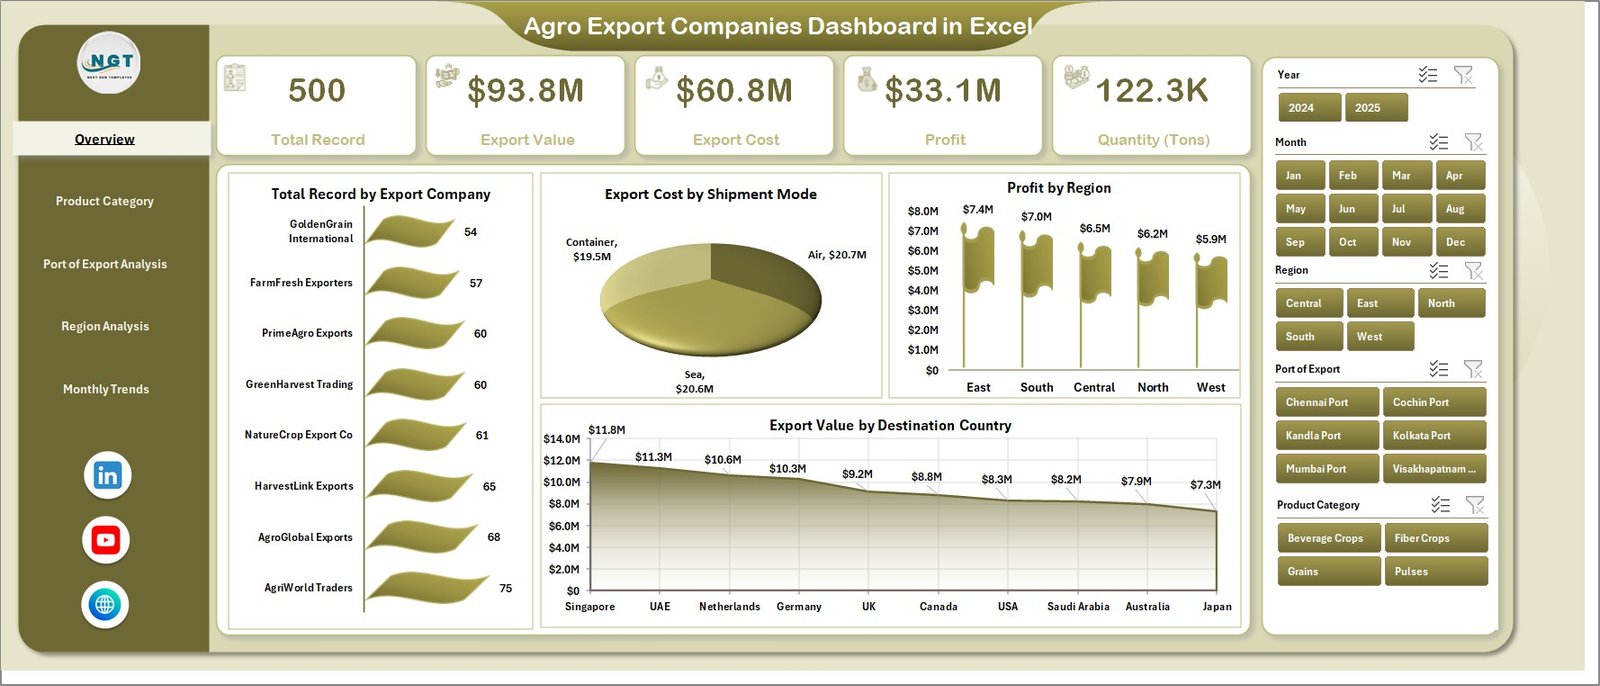
The Overview Page acts as the central summary page of the dashboard.
It provides a quick snapshot of the overall export operations.
Features of the Overview Page
-
Right-side slicers for quick filtering
-
4 KPI cards
-
4 analytical charts
Charts Included
-
Total Record by Export Company
Shows the number of export records handled by each export company. -
Export Cost by Shipment Mode
Displays the cost distribution across shipment modes such as air, sea, and land. -
Profit by Region
Highlights which regions generate the highest export profits. -
Export Value by Destination Country
Shows the export value for different destination countries.
Because this page summarizes key export metrics, managers can quickly understand the overall business performance.
2. Product Category Analysis – Which Products Drive Export Growth?
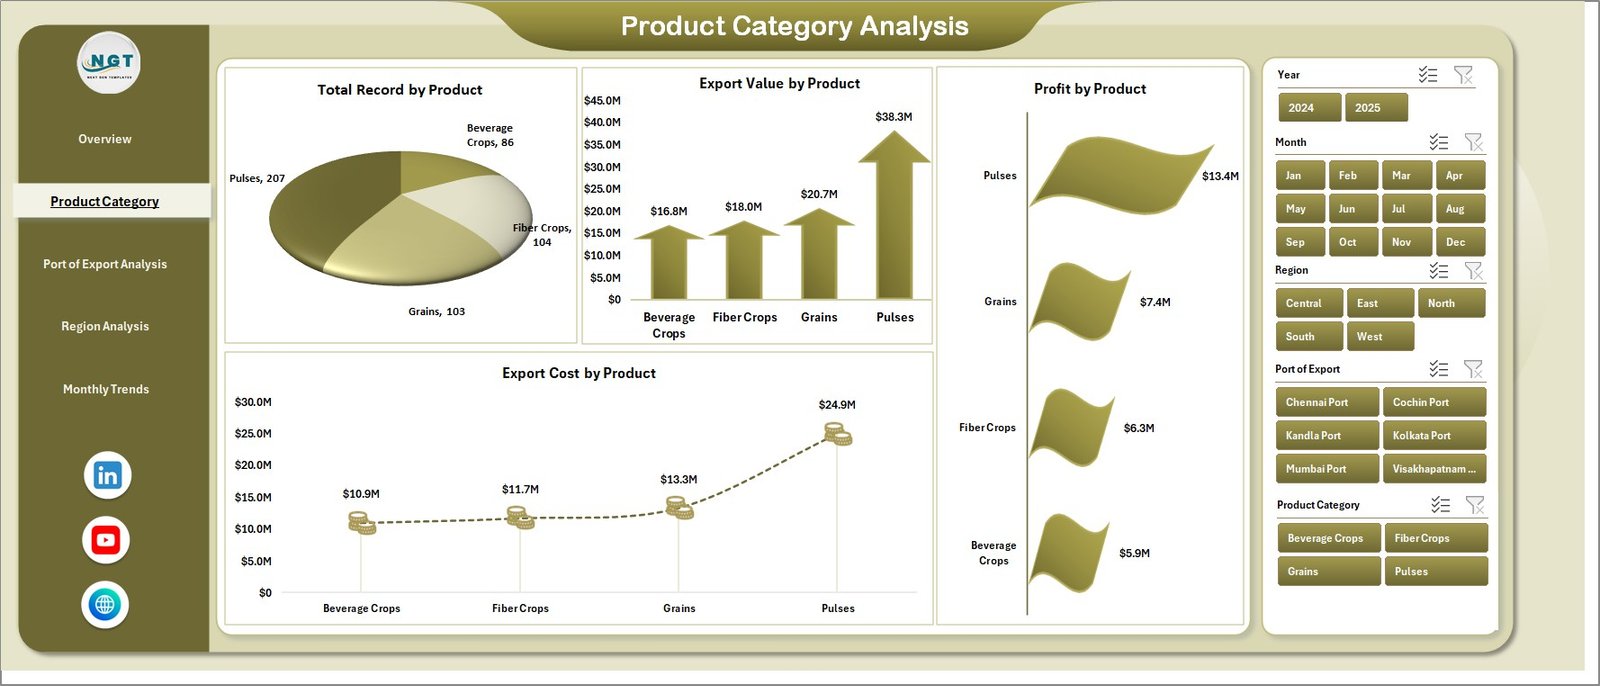
The Product Category Analysis Page focuses on analyzing exports by product type.
Agricultural exports often include various product categories such as grains, spices, fruits, vegetables, and processed foods.
Therefore, businesses must track product performance carefully.
Charts Included in This Page
-
Total Record by Product
-
Export Cost by Product
-
Profit by Product
-
Export Value by Product
This page helps organizations identify:
-
Top performing agricultural products
-
High-cost export products
-
Most profitable product categories
-
Export value trends by product
As a result, companies can prioritize high-demand products and optimize their export strategies.
3. Port of Export Analysis – Which Ports Handle the Most Shipments?
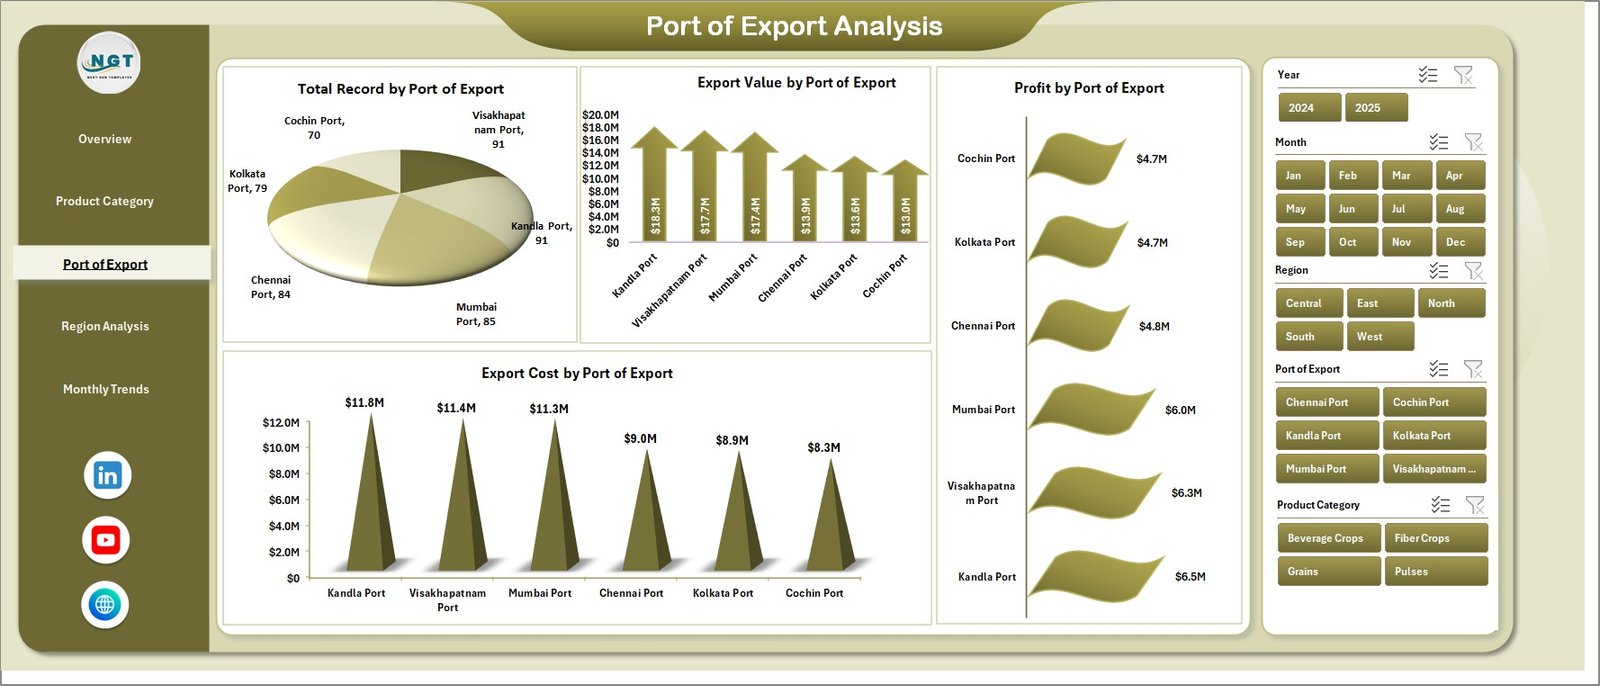
Ports play a crucial role in global trade. Agro export companies rely heavily on ports to ship products to international markets.
The Port of Export Analysis Page evaluates export operations by port.
Charts Included
-
Total Record by Port of Export
-
Export Cost by Port of Export
-
Profit by Port of Export
-
Export Value by Port of Export
This analysis allows organizations to:
-
Identify high-volume export ports
-
Compare logistics costs across ports
-
Evaluate profit margins by export port
-
Optimize shipping routes
Therefore, companies can improve logistics planning and reduce transportation costs.
4. Region Analysis – How Do Different Regions Perform?
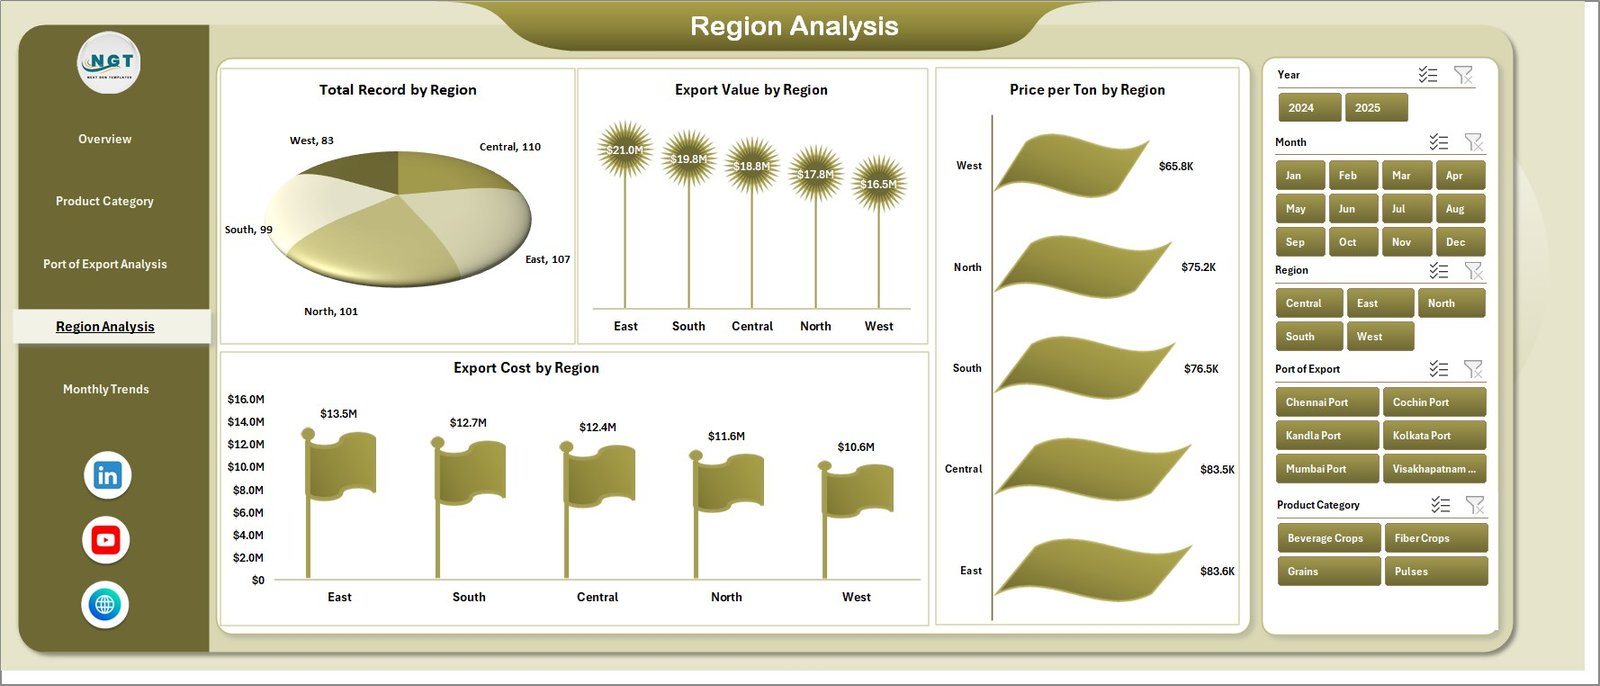
Agro exports often target multiple regions such as Asia, Europe, North America, and the Middle East.
However, each region may have different demand levels, pricing structures, and profit margins.
The Region Analysis Page provides a detailed view of regional export performance.
Charts Included
-
Total Record by Region
-
Export Cost by Region
-
Profit by Region
-
Export Value by Region
This page helps companies understand:
-
Which regions generate the most revenue
-
Where export costs are highest
-
Which regions deliver the highest profit margins
Consequently, export managers can focus on the most profitable markets.
Click to Purchases Agro Export Companies Dashboard in Excel
5. Month Analysis – Tracking Export Trends Over Time
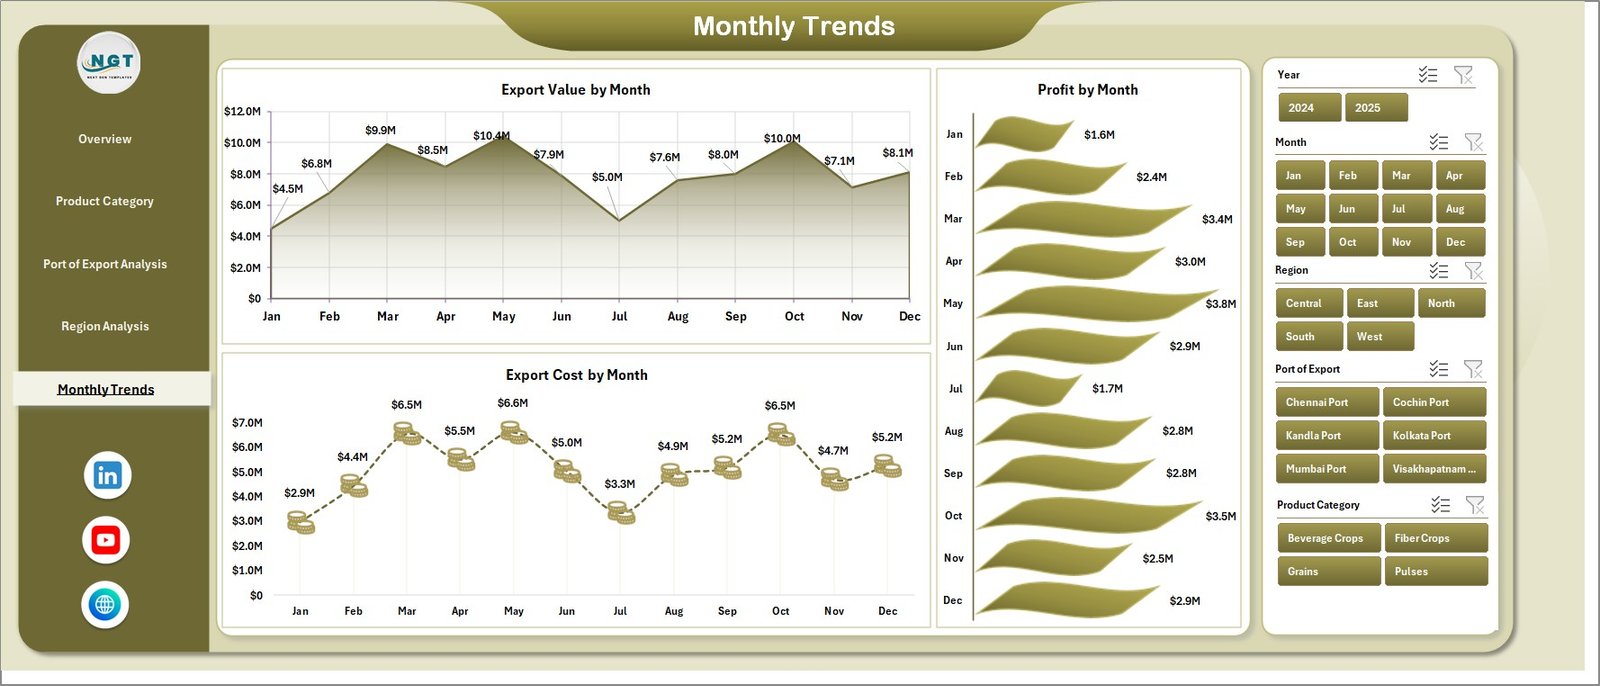
Export businesses must monitor performance trends across months.
Seasonal demand, weather conditions, and global market trends often affect agricultural exports.
The Month Analysis Page tracks export performance over time.
Charts Included
-
Export Cost by Month
-
Profit by Month
-
Export Value by Month
This page helps businesses identify:
-
Seasonal export trends
-
High-profit months
-
Cost fluctuations over time
Because of this analysis, companies can plan production and shipments more effectively.
Support Sheet and Data Sheet
The dashboard also includes backend sheets that support the reporting structure.
Data Sheet
The Data Sheet stores the raw export data.
It typically includes columns such as:
-
Export Company
-
Product Category
-
Shipment Mode
-
Port of Export
-
Destination Country
-
Region
-
Export Cost
-
Export Value
-
Profit
-
Export Date
This sheet acts as the main data source for the dashboard.
Support Sheet
The Support Sheet contains formulas, calculations, and supporting tables used to generate pivot charts and dashboard visuals.
Because these backend sheets handle calculations automatically, the dashboard updates instantly when new data is added.
Advantages of Agro Export Companies Dashboard in Excel
The dashboard offers several powerful advantages for agro export businesses.
1. Centralized Data Monitoring
The dashboard displays all export metrics in one place.
As a result, managers can review performance without opening multiple reports.
2. Faster Decision-Making
Interactive charts make complex export data easy to understand.
Therefore, decision-makers can respond quickly to market changes.
3. Improved Export Profitability
By analyzing costs, profits, and export values, companies can identify high-profit opportunities.
4. Better Product Performance Analysis
The dashboard clearly shows which products generate the most export value and profit.
5. Logistics Optimization
Port and shipment mode analysis help companies reduce transportation costs.
6. Regional Market Insights
Businesses can easily identify high-demand export regions and expand into profitable markets.
7. Time-Saving Reporting
Instead of creating manual reports every week, managers can simply refresh the dashboard.
Best Practices for the Agro Export Companies Dashboard in Excel
To get the best results from the dashboard, organizations should follow several best practices.
1. Maintain Clean Data
Always ensure that export data remains accurate and consistent.
Avoid duplicate records and incorrect entries.
2. Update the Data Regularly
Update the data sheet frequently to keep the dashboard current.
This ensures accurate reporting and analysis.
3. Use Standard Data Formats
Use consistent formats for dates, currency values, and categories.
Standard formatting improves dashboard performance.
4. Monitor Key KPIs
Focus on important performance indicators such as:
-
Export Value
-
Profit Margin
-
Export Cost
-
Shipment Volume
5. Use Filters for Deeper Analysis
Slicers and filters allow users to explore specific export scenarios.
Managers should use these tools to perform deeper analysis.
6. Review Trends Regularly
Analyze monthly and regional trends regularly to detect new opportunities or risks.
How to Use the Agro Export Companies Dashboard Effectively?
Using the dashboard effectively requires a structured approach.
Step 1 – Upload Export Data
First, enter export records into the Data Sheet.
Step 2 – Refresh the Dashboard
Next, refresh the pivot tables or charts to update the dashboard visuals.
Step 3 – Apply Filters
Use slicers to filter data by region, product, shipment mode, or company.
Step 4 – Analyze the Charts
Study the charts to identify:
-
Profit trends
-
Export cost patterns
-
Product demand
-
Regional opportunities
Step 5 – Make Data-Driven Decisions
Finally, use the insights to optimize export strategies and improve profitability.
Click to Purchases Agro Export Companies Dashboard in Excel
Conclusion
The global agricultural export industry continues to grow rapidly. Export companies must analyze large volumes of data related to shipments, products, regions, and profits.
However, manual reporting methods often slow down decision-making and hide important insights.
The Agro Export Companies Dashboard in Excel provides a powerful solution.
Because it combines data visualization, automation, and interactive analysis, companies can easily monitor export performance and make smarter decisions.
The dashboard helps businesses track export costs, analyze product categories, evaluate regional demand, and monitor monthly trends.
Therefore, organizations can improve operational efficiency, increase profitability, and expand into new international markets.
In short, the Agro Export Companies Dashboard in Excel becomes an essential analytical tool for modern agro export businesses.
Frequently Asked Questions (FAQs)
What is an Agro Export Companies Dashboard in Excel?
An Agro Export Companies Dashboard in Excel is an interactive reporting tool that helps organizations analyze agricultural export performance using charts, slicers, and pivot tables.
Who can use the Agro Export Companies Dashboard?
Several professionals can benefit from this dashboard, including:
-
Agro export companies
-
Export managers
-
Agricultural trading firms
-
Supply chain analysts
-
Business analysts
What type of data is required for this dashboard?
The dashboard typically requires export data such as:
-
Export company name
-
Product category
-
Shipment mode
-
Port of export
-
Destination country
-
Export cost
-
Export value
-
Profit
-
Export date
Why should export companies use Excel dashboards?
Excel dashboards provide interactive reporting, faster analysis, and easy visualization of export data. As a result, companies can make better business decisions.
Can this dashboard be customized?
Yes. Users can easily customize the dashboard by adding new KPIs, charts, filters, or product categories based on their export operations.
How often should the dashboard be updated?
Companies should update the dashboard regularly, ideally weekly or monthly, to ensure accurate and timely export performance analysis.
Visit our YouTube channel to learn step-by-step video tutorials