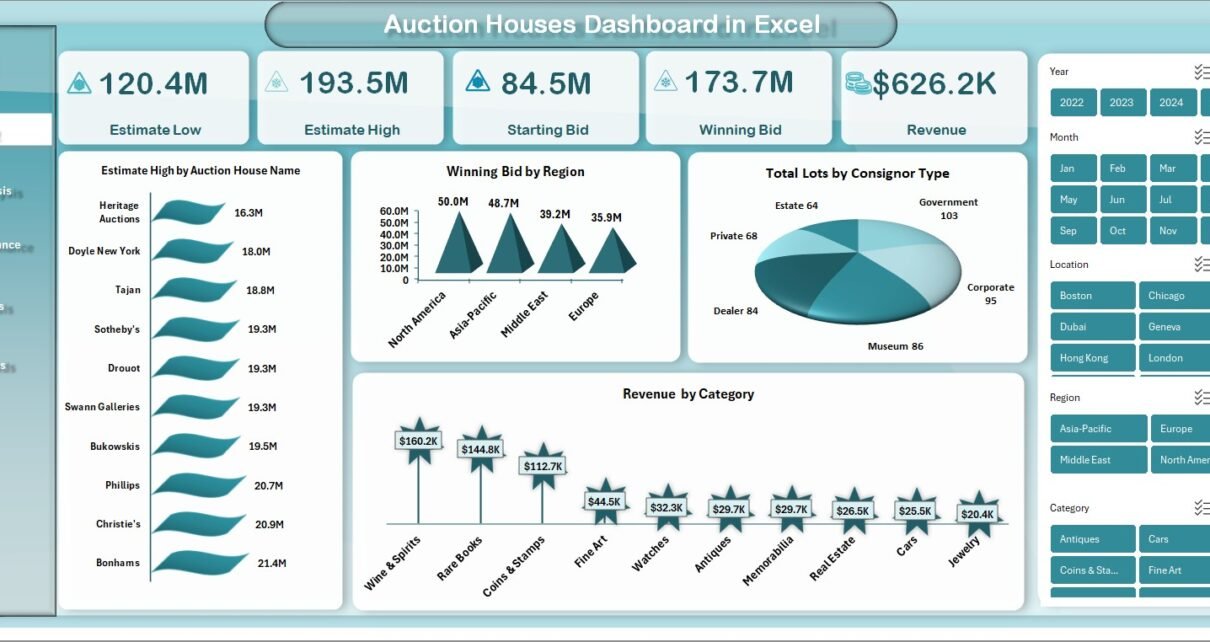
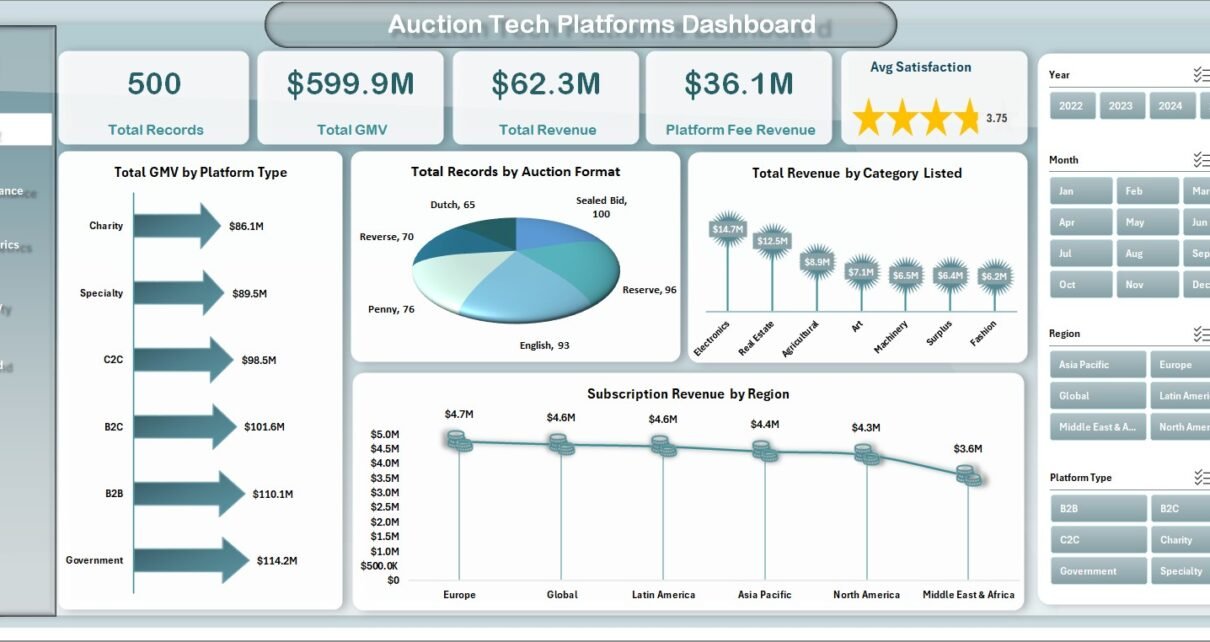
• Excel and VBA
    • VBA Course
    • Shortcut Keys
    • Useful Formulas
    • Basic Charts
    • Advanced Chart
    • Sort and Filter
    • Pivot Table
    • Data Validation
    • Conditional Formatting
    • Auto Fill and Flash Fill
    • Find and Replace
  • DownloadsPopular
    • Excel VBA Tools
    • Dashboard
      • Excel Dashboard
      • KPI Dashboard
      • Power BI Dashboard
    • Charts
      • Progress Charts
      • Info-graphics
      • Animated Charts
      • Comparisons
      • Gantt Charts
      • Heatmaps
      • Speedometers
      • Timelines
    • Inventory Management
    • HR and Payrolls
    • VBA Automation
    • Utilities and Converters
    • Checklist
    • Calendars
    • Data Analysis
    • Excel Templates
    • Financial Tools
    • Project Management
    • Sales and Marketing
    • Productivity
  • Excel Dashboard
  • Templates
  • Tutorials
    • Charts and Visualization
    • VBA
    • Excel Tips and Tricks
  • Power BI
  • Template StoreNew
  • CoursesNew
  • About Us
  • Contact Us

PK: An Excel Expert

Transforming Data into Decisions

Dashboard

This category provides detailed tutorials on creating effective and informative dashboards in Excel. Whether you need to track your business’s key performance indicators (KPIs) or present complex data in a simplified manner, our tutorials will guide you through the process. Each tutorial comes with a free practice file for download and tutorial videos to help you follow along easily. Start your Excel dashboard tutorial now and enhance your data analysis and presentation skills with this powerful tool. Impress your colleagues and boss with insightful and attractive dashboards by exploring this category today.

Dashboard Power BI

Arbitration and Mediation KPI Dashboard in Power BI

January 30, 2026January 30, 2026 PKComments Off on Arbitration and Mediation KPI Dashboard in Power BI
Arbitration and mediation play a crucial role in resolving disputes efficiently, fairly, and cost-effectively. However, when organizations manage dispute resolution using scattered Excel files, emails, or static reports, visibility drops
Read More
Dashboard Power BI

Courier Services Dashboard in Power BI

January 30, 2026January 30, 2026 PKComments Off on Courier Services Dashboard in Power BI
Courier and logistics operations move fast. Therefore, decision-makers need clear, timely, and accurate insights. However, scattered spreadsheets and static reports slow teams down. That is exactly why a Courier Services
Read More
Dashboard Power BI

Airports Dashboard in Power BI

January 30, 2026January 30, 2026 PKComments Off on Airports Dashboard in Power BI
Managing airport operations has never been simple. Airports handle thousands of flights, passengers, baggage movements, and airline operations every single day. Therefore, even a small disruption can create delays, operational
Read More
Dashboard

Courier Services Dashboard in Excel

January 30, 2026January 30, 2026 PKComments Off on Courier Services Dashboard in Excel
Courier and logistics operations move at high speed every day. However, without clear visibility into shipments, delivery performance, costs, and returns, courier businesses struggle to stay profitable and competitive. That
Read More
Dashboard

Arbitration and Mediation KPI Dashboard in Excel

January 30, 2026January 30, 2026 PKComments Off on Arbitration and Mediation KPI Dashboard in Excel
Arbitration and mediation play a vital role in resolving disputes efficiently, fairly, and cost-effectively. However, without proper measurement, organizations struggle to understand how well their dispute resolution processes perform. Therefore,
Read More
Dashboard

Airports Dashboard in Excel

January 30, 2026January 30, 2026 PKComments Off on Airports Dashboard in Excel
Managing airport operations involves handling thousands of flights, multiple airlines, regional traffic patterns, baggage handling issues, and frequent delays. However, when data remains scattered across spreadsheets or systems, decision-making becomes
Read More
Dashboard Power BI

Intellectual Property (IP) KPI Dashboard in Power BI

January 30, 2026January 30, 2026 PKComments Off on Intellectual Property (IP) KPI Dashboard in Power BI
Managing Intellectual Property (IP) is no longer limited to filing patents or registering trademarks. Instead, organizations now treat IP as a strategic business asset. Therefore, they must measure performance, track
Read More
Dashboard

Intellectual Property (IP) KPI Dashboard in Excel

January 30, 2026January 30, 2026 PKComments Off on Intellectual Property (IP) KPI Dashboard in Excel
Managing intellectual property effectively has become a strategic priority for modern organizations. However, tracking patents, trademarks, copyrights, licensing performance, and legal timelines often becomes difficult when data stays scattered across
Read More
Dashboard Power BI

Cosmetics and Skincare Dashboard in Power BI

January 29, 2026January 29, 2026 PKComments Off on Cosmetics and Skincare Dashboard in Power BI
The cosmetics and skincare industry moves fast. New products launch every month, trends change quickly, and customer preferences evolve constantly. Because of this, beauty brands, distributors, and retailers cannot rely
Read More
Dashboard Power BI

Toy and Games Industry Dashboard in Power BI

January 29, 2026January 29, 2026 PKComments Off on Toy and Games Industry Dashboard in Power BI
The toy and games industry thrives on creativity, trends, and seasonal demand. However, without clear data visibility, even the most innovative toy businesses struggle to grow. That is exactly where
Read More

Posts pagination

1 2 … 192 Next
  • Excel and VBA
    • VBA Course
    • Shortcut Keys
    • Useful Formulas
    • Basic Charts
    • Advanced Chart
    • Sort and Filter
    • Pivot Table
    • Data Validation
    • Conditional Formatting
    • Auto Fill and Flash Fill
    • Find and Replace
  • DownloadsPopular
    • Excel VBA Tools
    • Dashboard
      • Excel Dashboard
      • KPI Dashboard
      • Power BI Dashboard
    • Charts
      • Progress Charts
      • Info-graphics
      • Animated Charts
      • Comparisons
      • Gantt Charts
      • Heatmaps
      • Speedometers
      • Timelines
    • Inventory Management
    • HR and Payrolls
    • VBA Automation
    • Utilities and Converters
    • Checklist
    • Calendars
    • Data Analysis
    • Excel Templates
    • Financial Tools
    • Project Management
    • Sales and Marketing
    • Productivity
  • Excel Dashboard
  • Templates
  • Tutorials
    • Charts and Visualization
    • VBA
    • Excel Tips and Tricks
  • Power BI
  • Template StoreNew
  • CoursesNew
  • About Us
  • Contact Us
Copyright © 2023 PK-AnExcelExpert.com - Privacy Policy
This website uses cookies to improve your user experience, analyze site traffic and serve targeted ads in accordance with our Privacy Policy ACCEPT
Privacy & Cookies Policy

Privacy Overview

This website uses cookies to improve your experience while you navigate through the website. Out of these cookies, the cookies that are categorized as necessary are stored on your browser as they are essential for the working of basic functionalities of the website. We also use third-party cookies that help us analyze and understand how you use this website. These cookies will be stored in your browser only with your consent. You also have the option to opt-out of these cookies. But opting out of some of these cookies may have an effect on your browsing experience.
Necessary
Always Enabled
Necessary cookies are absolutely essential for the website to function properly. This category only includes cookies that ensures basic functionalities and security features of the website. These cookies do not store any personal information.
Non-necessary
Any cookies that may not be particularly necessary for the website to function and is used specifically to collect user personal data via analytics, ads, other embedded contents are termed as non-necessary cookies. It is mandatory to procure user consent prior to running these cookies on your website.
SAVE & ACCEPT