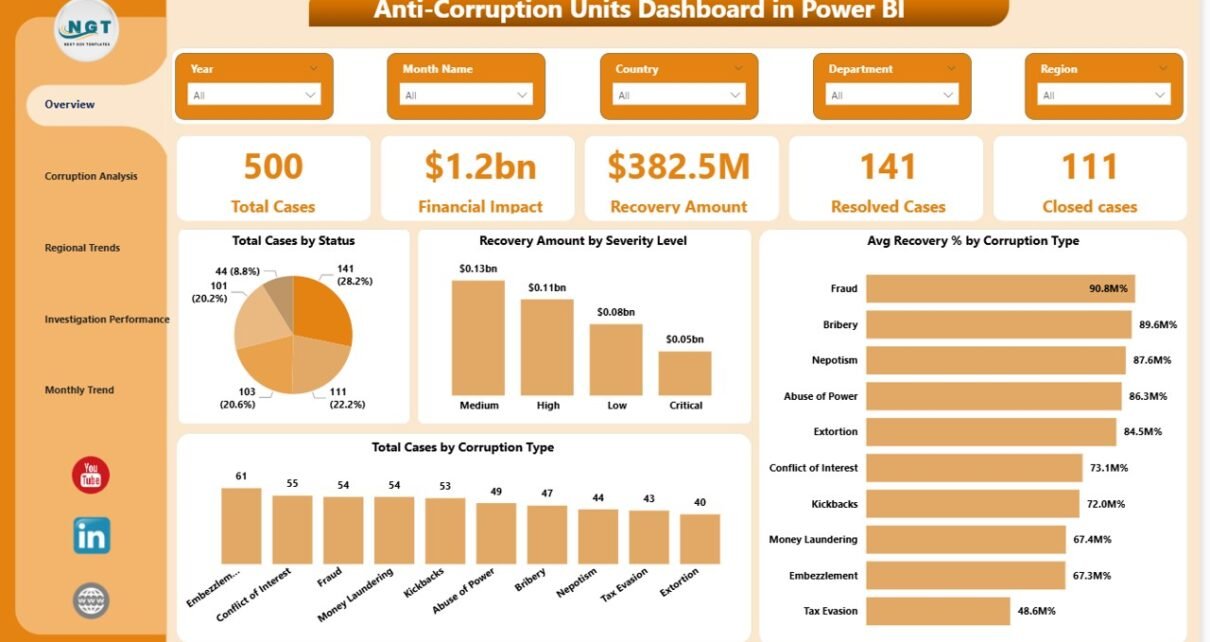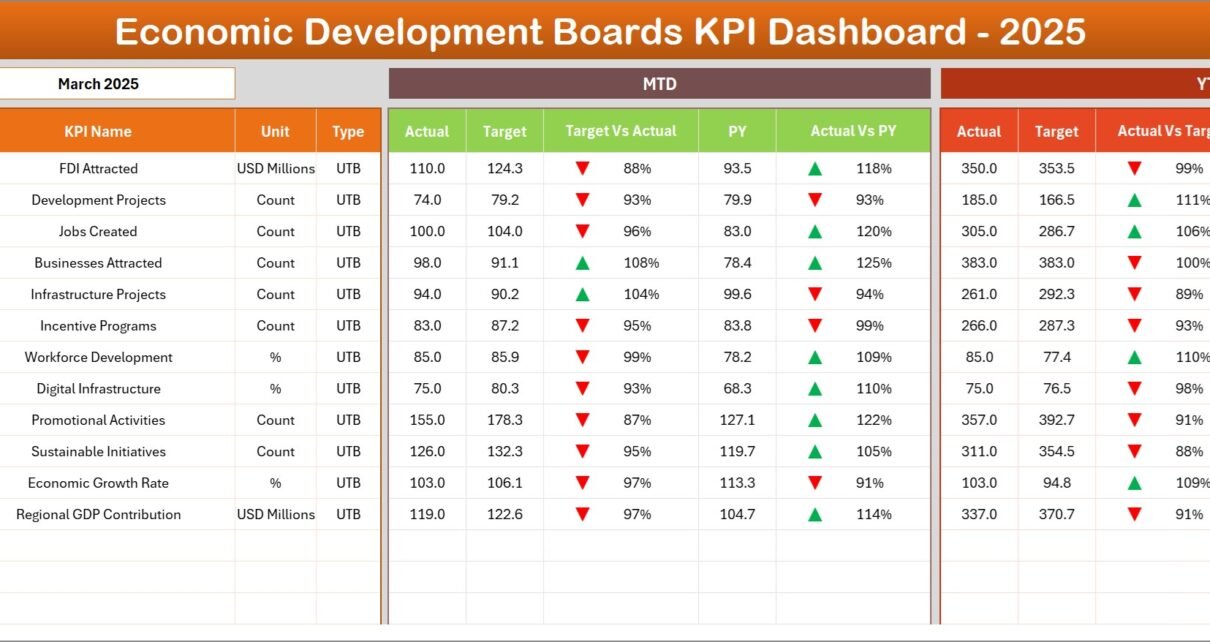
Economic Development Boards KPI Dashboard in Excel
Economic Development Boards (EDBs) play a crucial role in driving regional growth, attracting investments, supporting industries, and creating employment opportunities. However, managing and measuring the success of economic initiatives can