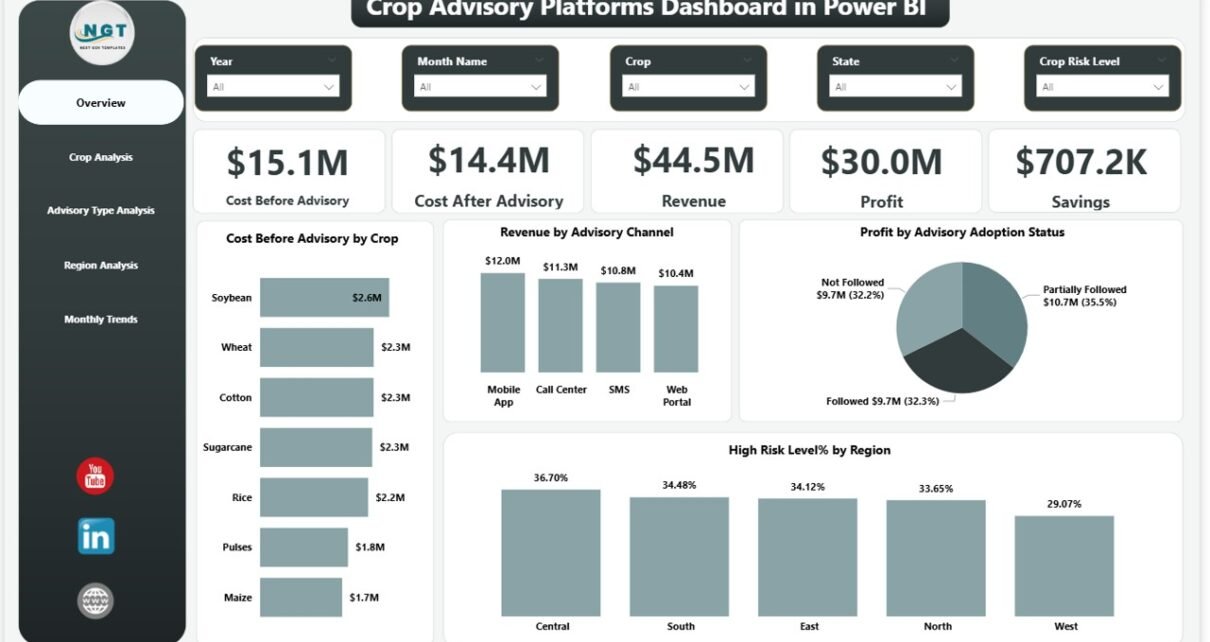
• Excel and VBA
    • VBA Course
    • Shortcut Keys
    • Useful Formulas
    • Basic Charts
    • Advanced Chart
    • Sort and Filter
    • Pivot Table
    • Data Validation
    • Conditional Formatting
    • Auto Fill and Flash Fill
    • Find and Replace
  • DownloadsPopular
    • Excel VBA Tools
    • Dashboard
      • Excel Dashboard
      • KPI Dashboard
      • Power BI Dashboard
    • Charts
      • Progress Charts
      • Info-graphics
      • Animated Charts
      • Comparisons
      • Gantt Charts
      • Heatmaps
      • Speedometers
      • Timelines
    • Inventory Management
    • HR and Payrolls
    • VBA Automation
    • Utilities and Converters
    • Checklist
    • Calendars
    • Data Analysis
    • Excel Templates
    • Financial Tools
    • Project Management
    • Sales and Marketing
    • Productivity
  • Excel Dashboard
  • Templates
  • Tutorials
    • Charts and Visualization
    • VBA
    • Excel Tips and Tricks
  • Power BI
  • Template StoreNew
  • CoursesNew
  • About Us
  • Contact Us

PK: An Excel Expert

Transforming Data into Decisions

Dashboard

This category provides detailed tutorials on creating effective and informative dashboards in Excel. Whether you need to track your business’s key performance indicators (KPIs) or present complex data in a simplified manner, our tutorials will guide you through the process. Each tutorial comes with a free practice file for download and tutorial videos to help you follow along easily. Start your Excel dashboard tutorial now and enhance your data analysis and presentation skills with this powerful tool. Impress your colleagues and boss with insightful and attractive dashboards by exploring this category today.

Dashboard Power BI

ERP Systems KPI Dashboard in Power BI

January 19, 2026January 19, 2026 PKComments Off on ERP Systems KPI Dashboard in Power BI
Modern enterprises rely heavily on ERP systems to manage finance, operations, supply chain, HR, and sales. However, ERP systems generate massive data volumes every day. Therefore, businesses must convert that
Read More
Dashboard Power BI

Automation Units KPI Dashboard in Power BI

January 19, 2026January 19, 2026 PKComments Off on Automation Units KPI Dashboard in Power BI
In today’s fast-moving industrial and manufacturing environment, automation units play a critical role in productivity, quality, and cost control. However, automation without measurement creates blind spots. Therefore, organizations increasingly rely
Read More
Dashboard

ERP Systems KPI Dashboard in Excel

January 19, 2026January 19, 2026 PKComments Off on ERP Systems KPI Dashboard in Excel
Enterprise Resource Planning (ERP) systems sit at the heart of modern organizations. They connect finance, operations, procurement, inventory, HR, and sales into a single platform. However, simply implementing an ERP
Read More
Dashboard

Automation Units KPI Dashboard in Excel

January 19, 2026January 19, 2026 PKComments Off on Automation Units KPI Dashboard in Excel
Automation units play a crucial role in modern industries. They help organizations increase productivity, reduce manual effort, and maintain consistent quality. However, automation alone does not guarantee success. You must
Read More
Dashboard Power BI

Veterinary Services Dashboard in Power BI

January 18, 2026January 18, 2026 PKComments Off on Veterinary Services Dashboard in Power BI
Running a veterinary clinic involves far more than treating pets. You manage appointments, medications, service costs, customer satisfaction, and monthly performance at the same time. However, when this data stays
Read More
Dashboard

Landscaping Services Dashboard in Excel

January 18, 2026January 18, 2026 PKComments Off on Landscaping Services Dashboard in Excel
Running a landscaping business requires much more than delivering beautiful outdoor spaces. You must manage invoices, track labor hours, control costs, monitor profits, and understand customer behavior. However, when this
Read More
Dashboard

Veterinary Services Dashboard in Excel

January 18, 2026January 18, 2026 PKComments Off on Veterinary Services Dashboard in Excel
Managing a veterinary clinic involves much more than treating animals. Every day, clinics handle appointments, services, medications, billing, customer satisfaction, and operational costs. However, when this information stays scattered across
Read More
Dashboard

Chemical Manufacturing Dashboard in Excel

January 18, 2026January 18, 2026 PKComments Off on Chemical Manufacturing Dashboard in Excel
In today’s highly regulated and cost-sensitive chemical industry, data-driven decision-making is no longer optional. Chemical manufacturers deal with massive volumes of operational, financial, environmental, and quality data every single day.
Read More
Dashboard Power BI

Physiotherapy and Rehabilitation Dashboard in Power BI

January 18, 2026January 18, 2026 PKComments Off on Physiotherapy and Rehabilitation Dashboard in Power BI
Managing a physiotherapy and rehabilitation center requires more than clinical expertise. You must also track patient progress, treatment efficiency, therapist performance, and financial health. However, when data remains scattered across
Read More
Dashboard

Physiotherapy and Rehabilitation Dashboard in excel

January 18, 2026January 18, 2026 PKComments Off on Physiotherapy and Rehabilitation Dashboard in excel
Managing physiotherapy and rehabilitation services requires accuracy, clarity, and speed. Clinics, hospitals, and independent physiotherapists handle patient sessions, treatment costs, therapist performance, and recovery outcomes every day. However, when this
Read More

Posts pagination

Previous 1 … 12 13 14 … 194 Next
  • Excel and VBA
    • VBA Course
    • Shortcut Keys
    • Useful Formulas
    • Basic Charts
    • Advanced Chart
    • Sort and Filter
    • Pivot Table
    • Data Validation
    • Conditional Formatting
    • Auto Fill and Flash Fill
    • Find and Replace
  • DownloadsPopular
    • Excel VBA Tools
    • Dashboard
      • Excel Dashboard
      • KPI Dashboard
      • Power BI Dashboard
    • Charts
      • Progress Charts
      • Info-graphics
      • Animated Charts
      • Comparisons
      • Gantt Charts
      • Heatmaps
      • Speedometers
      • Timelines
    • Inventory Management
    • HR and Payrolls
    • VBA Automation
    • Utilities and Converters
    • Checklist
    • Calendars
    • Data Analysis
    • Excel Templates
    • Financial Tools
    • Project Management
    • Sales and Marketing
    • Productivity
  • Excel Dashboard
  • Templates
  • Tutorials
    • Charts and Visualization
    • VBA
    • Excel Tips and Tricks
  • Power BI
  • Template StoreNew
  • CoursesNew
  • About Us
  • Contact Us
Copyright © 2023 PK-AnExcelExpert.com - Privacy Policy
This website uses cookies to improve your user experience, analyze site traffic and serve targeted ads in accordance with our Privacy Policy ACCEPT
Privacy & Cookies Policy

Privacy Overview

This website uses cookies to improve your experience while you navigate through the website. Out of these cookies, the cookies that are categorized as necessary are stored on your browser as they are essential for the working of basic functionalities of the website. We also use third-party cookies that help us analyze and understand how you use this website. These cookies will be stored in your browser only with your consent. You also have the option to opt-out of these cookies. But opting out of some of these cookies may have an effect on your browsing experience.
Necessary
Always Enabled
Necessary cookies are absolutely essential for the website to function properly. This category only includes cookies that ensures basic functionalities and security features of the website. These cookies do not store any personal information.
Non-necessary
Any cookies that may not be particularly necessary for the website to function and is used specifically to collect user personal data via analytics, ads, other embedded contents are termed as non-necessary cookies. It is mandatory to procure user consent prior to running these cookies on your website.
SAVE & ACCEPT