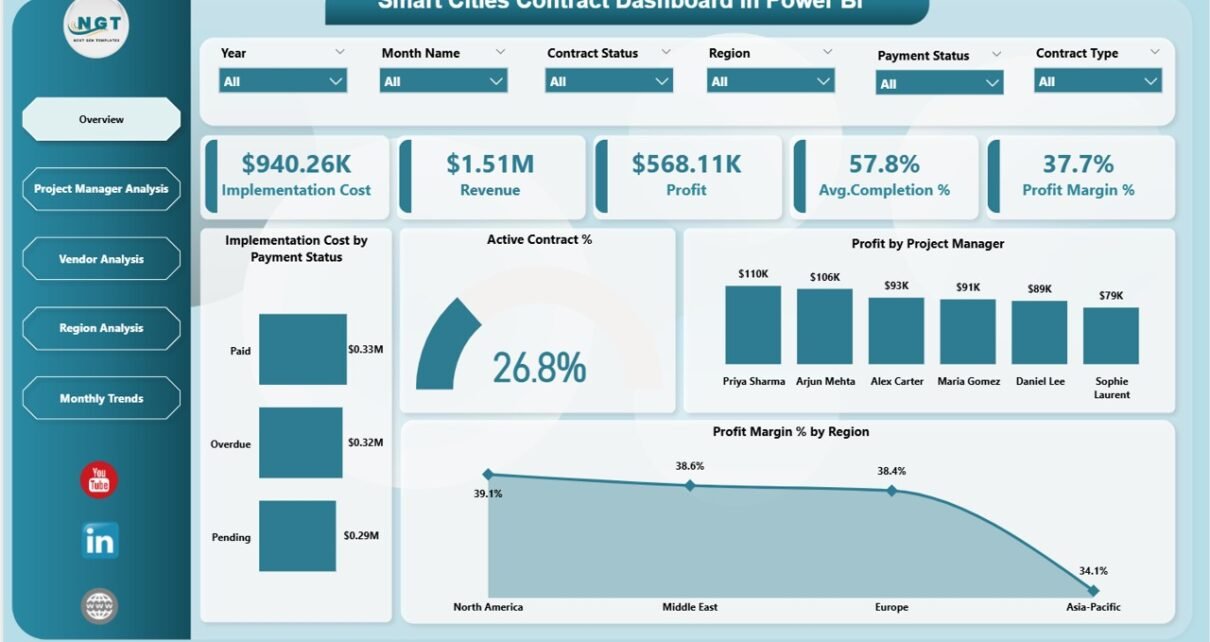
• Excel and VBA
    • VBA Course
    • Shortcut Keys
    • Useful Formulas
    • Basic Charts
    • Advanced Chart
    • Sort and Filter
    • Pivot Table
    • Data Validation
    • Conditional Formatting
    • Auto Fill and Flash Fill
    • Find and Replace
  • DownloadsPopular
    • Excel VBA Tools
    • Dashboard
      • Excel Dashboard
      • KPI Dashboard
      • Power BI Dashboard
    • Charts
      • Progress Charts
      • Info-graphics
      • Animated Charts
      • Comparisons
      • Gantt Charts
      • Heatmaps
      • Speedometers
      • Timelines
    • Inventory Management
    • HR and Payrolls
    • VBA Automation
    • Utilities and Converters
    • Checklist
    • Calendars
    • Data Analysis
    • Excel Templates
    • Financial Tools
    • Project Management
    • Sales and Marketing
    • Productivity
  • Excel Dashboard
  • Templates
  • Tutorials
    • Charts and Visualization
    • VBA
    • Excel Tips and Tricks
  • Power BI
  • Template StoreNew
  • CoursesNew
  • About Us
  • Contact Us

PK: An Excel Expert

Transforming Data into Decisions

Dashboard

This category provides detailed tutorials on creating effective and informative dashboards in Excel. Whether you need to track your business’s key performance indicators (KPIs) or present complex data in a simplified manner, our tutorials will guide you through the process. Each tutorial comes with a free practice file for download and tutorial videos to help you follow along easily. Start your Excel dashboard tutorial now and enhance your data analysis and presentation skills with this powerful tool. Impress your colleagues and boss with insightful and attractive dashboards by exploring this category today.

Dashboard Power BI

Call Center Operations Dashboard in Power BI

January 18, 2026January 18, 2026 PKComments Off on Call Center Operations Dashboard in Power BI
Managing a call center demands speed, accuracy, and clear visibility into daily operations. However, raw call logs and scattered reports often slow down decision-making. Therefore, businesses increasingly rely on a
Read More
Dashboard Power BI

Machine Learning Labs KPI Dashboard in Power BI

January 18, 2026January 18, 2026 PKComments Off on Machine Learning Labs KPI Dashboard in Power BI
Running a machine learning lab requires constant tracking of experiments, models, data quality, costs, timelines, and outcomes. However, when teams store this information in scattered Excel files or disconnected tools,
Read More
Dashboard Power BI

Equipment Leasing KPI Dashboard in Power BI

January 18, 2026January 18, 2026 PKComments Off on Equipment Leasing KPI Dashboard in Power BI
Managing an equipment leasing business requires constant tracking of performance, targets, costs, and utilization. However, raw data stored in spreadsheets rarely gives a clear picture. Therefore, companies increasingly rely on
Read More
Dashboard

Equipment Leasing KPI Dashboard in Excel

January 18, 2026January 18, 2026 PKComments Off on Equipment Leasing KPI Dashboard in Excel
Managing an equipment leasing business involves constant tracking of assets, revenue, utilization, costs, and profitability. However, many leasing companies still rely on scattered Excel sheets, manual reports, and delayed summaries.
Read More
Dashboard

Machine Learning Labs KPI Dashboard in Excel

January 18, 2026January 18, 2026 PKComments Off on Machine Learning Labs KPI Dashboard in Excel
Running a machine learning lab means managing data experiments, models, infrastructure, costs, timelines, and research outcomes—all at the same time. However, when KPIs remain scattered across spreadsheets, tracking performance becomes
Read More
Dashboard

Call Center Operations Dashboard in Excel

January 17, 2026January 17, 2026 PKComments Off on Call Center Operations Dashboard in Excel
Running a call center means managing hundreds or even thousands of calls every day. Agents handle different customer issues, managers track costs, and leadership teams expect clear performance reports. However,
Read More
Dashboard Power BI

Market Research Dashboard in Power BI

January 17, 2026January 17, 2026 PKComments Off on Market Research Dashboard in Power BI
Market research shapes every successful business strategy. Companies that clearly understand customer needs, satisfaction levels, pricing sensitivity, and response behavior always stay ahead of competitors. However, raw survey data stored
Read More
Dashboard

Market Research Dashboard in Excel

January 17, 2026January 17, 2026 PKComments Off on Market Research Dashboard in Excel
Market research drives every successful business decision. Companies that understand customer needs, pricing sensitivity, satisfaction levels, and regional trends always stay ahead of competitors. However, raw survey data in Excel
Read More
Dashboard Power BI

Heavy Machinery Dashboard in Power BI

January 17, 2026January 17, 2026 PKComments Off on Heavy Machinery Dashboard in Power BI
Heavy machinery plays a critical role in industries such as construction, mining, manufacturing, infrastructure, and energy. Excavators, cranes, loaders, bulldozers, and other machines operate for long hours and involve high
Read More
Dashboard

Heavy Machinery Dashboard in Excel

January 17, 2026January 17, 2026 PKComments Off on Heavy Machinery Dashboard in Excel
Managing heavy machinery without clear data always creates risk. Equipment breakdowns delay projects. Maintenance costs increase suddenly. Productivity drops without warning. Therefore, companies need a simple yet powerful way to
Read More

Posts pagination

Previous 1 … 13 14 15 … 194 Next
  • Excel and VBA
    • VBA Course
    • Shortcut Keys
    • Useful Formulas
    • Basic Charts
    • Advanced Chart
    • Sort and Filter
    • Pivot Table
    • Data Validation
    • Conditional Formatting
    • Auto Fill and Flash Fill
    • Find and Replace
  • DownloadsPopular
    • Excel VBA Tools
    • Dashboard
      • Excel Dashboard
      • KPI Dashboard
      • Power BI Dashboard
    • Charts
      • Progress Charts
      • Info-graphics
      • Animated Charts
      • Comparisons
      • Gantt Charts
      • Heatmaps
      • Speedometers
      • Timelines
    • Inventory Management
    • HR and Payrolls
    • VBA Automation
    • Utilities and Converters
    • Checklist
    • Calendars
    • Data Analysis
    • Excel Templates
    • Financial Tools
    • Project Management
    • Sales and Marketing
    • Productivity
  • Excel Dashboard
  • Templates
  • Tutorials
    • Charts and Visualization
    • VBA
    • Excel Tips and Tricks
  • Power BI
  • Template StoreNew
  • CoursesNew
  • About Us
  • Contact Us
Copyright © 2023 PK-AnExcelExpert.com - Privacy Policy
This website uses cookies to improve your user experience, analyze site traffic and serve targeted ads in accordance with our Privacy Policy ACCEPT
Privacy & Cookies Policy

Privacy Overview

This website uses cookies to improve your experience while you navigate through the website. Out of these cookies, the cookies that are categorized as necessary are stored on your browser as they are essential for the working of basic functionalities of the website. We also use third-party cookies that help us analyze and understand how you use this website. These cookies will be stored in your browser only with your consent. You also have the option to opt-out of these cookies. But opting out of some of these cookies may have an effect on your browsing experience.
Necessary
Always Enabled
Necessary cookies are absolutely essential for the website to function properly. This category only includes cookies that ensures basic functionalities and security features of the website. These cookies do not store any personal information.
Non-necessary
Any cookies that may not be particularly necessary for the website to function and is used specifically to collect user personal data via analytics, ads, other embedded contents are termed as non-necessary cookies. It is mandatory to procure user consent prior to running these cookies on your website.
SAVE & ACCEPT