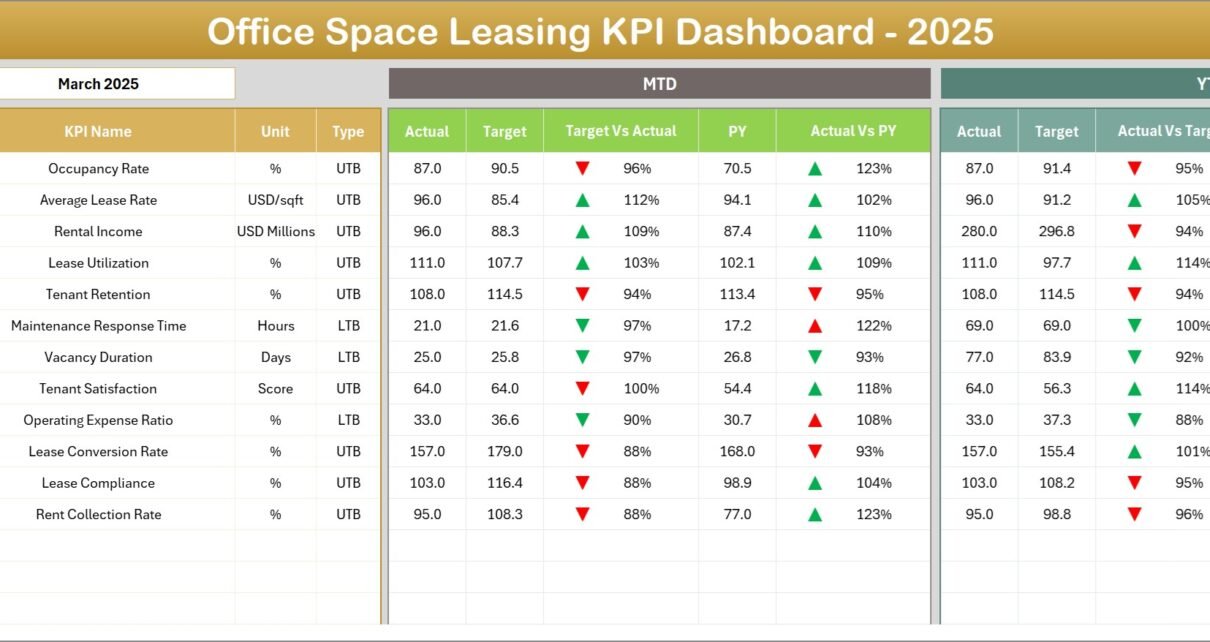
Office Space Leasing KPI Dashboard in Excel
Managing office space leasing operations requires accurate tracking of performance metrics such as occupancy rates, lease renewals, rental income, tenant retention, and property utilization. Without proper monitoring, property managers often