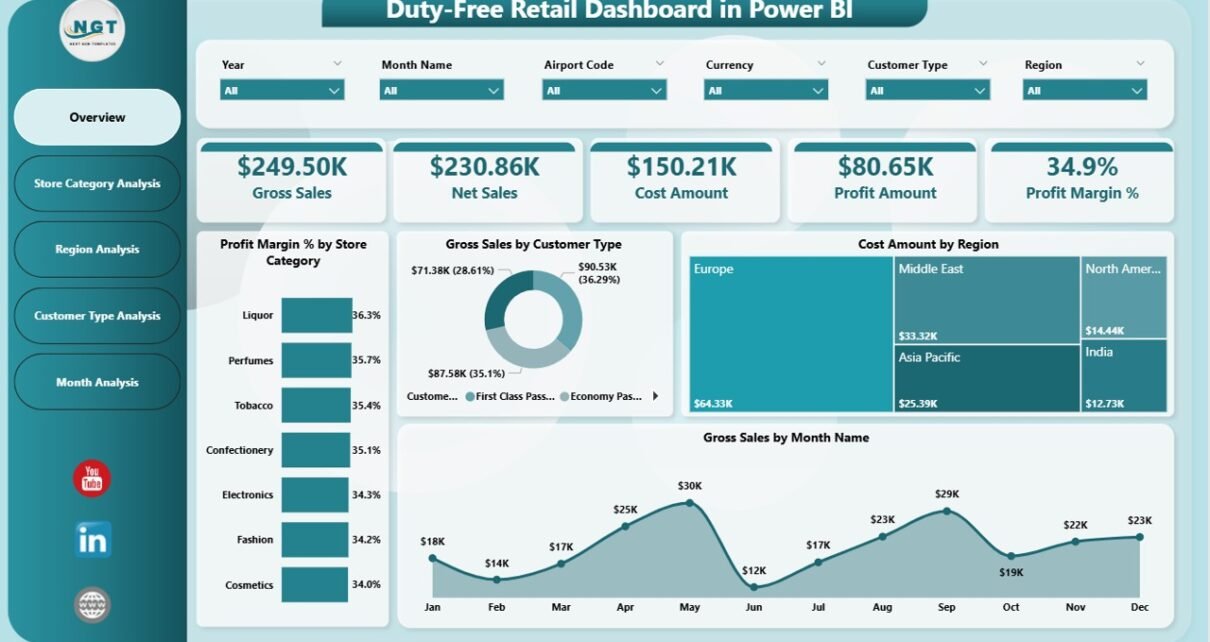
Duty-Free Retail Dashboard in Power BI
Managing duty-free retail operations requires speed, accuracy, and clear insights. However, many duty-free retailers still depend on multiple Excel files, manual reports, and delayed summaries. As a result, decision-makers struggle