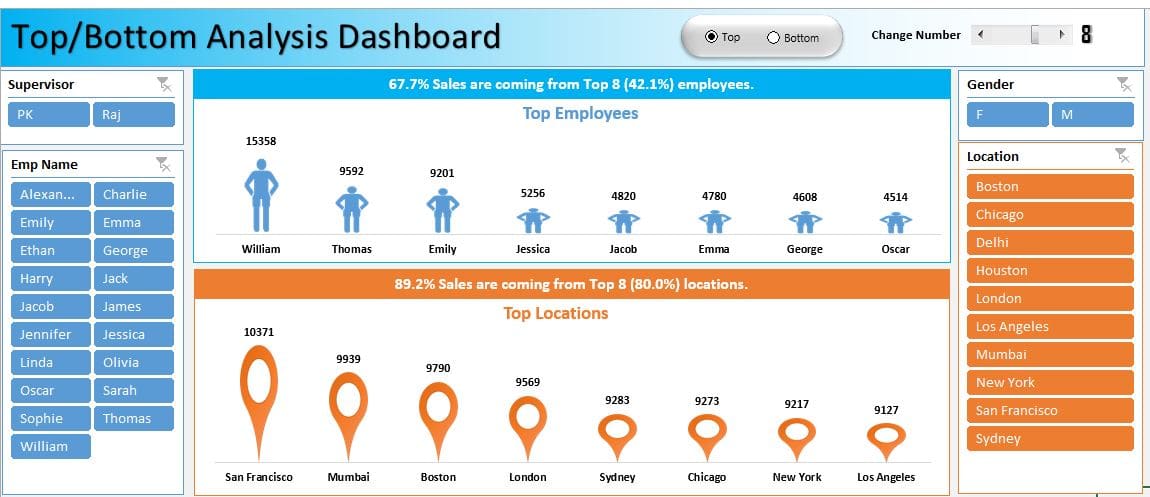
Top/Bottom Analysis dashboard in Excel
In this article, we have created Top/Bottom Analysis dashboard using a sales dataset. This is a dynamic dashboard. We have used Slicers, Form control Option buttons and form control Scrollbar
Transforming Data into Decisions
This category provides detailed tutorials on creating effective and informative dashboards in Excel. Whether you need to track your business’s key performance indicators (KPIs) or present complex data in a simplified manner, our tutorials will guide you through the process. Each tutorial comes with a free practice file for download and tutorial videos to help you follow along easily. Start your Excel dashboard tutorial now and enhance your data analysis and presentation skills with this powerful tool. Impress your colleagues and boss with insightful and attractive dashboards by exploring this category today.