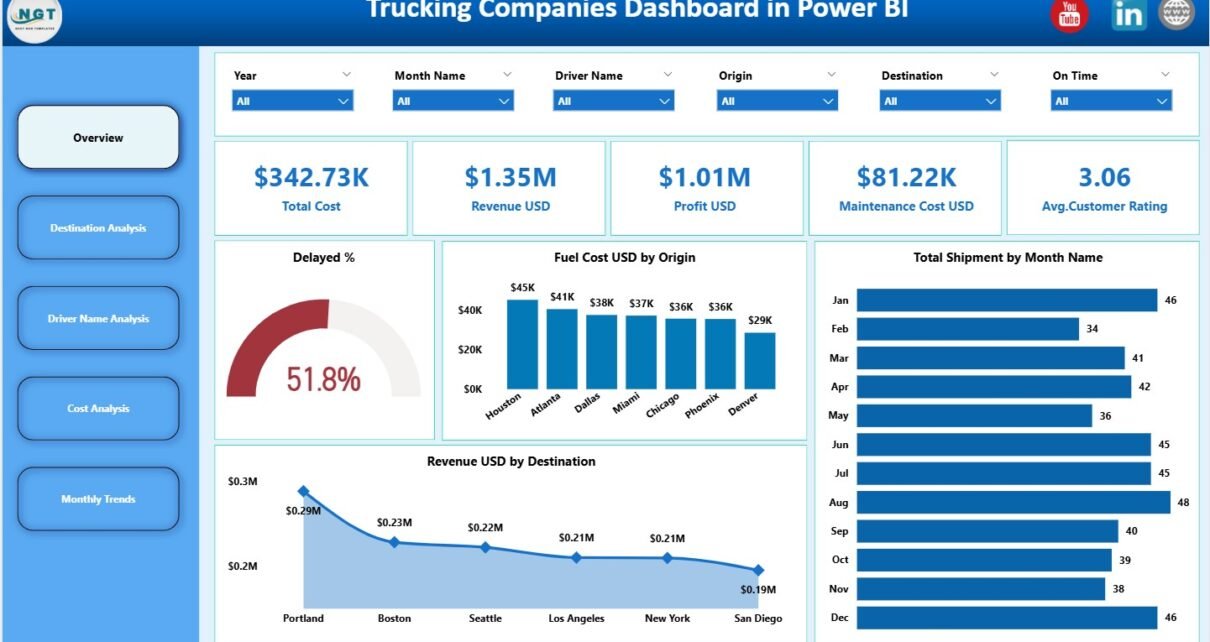
Trucking Companies Dashboard in Power BI
Trucking companies operate in a highly competitive and cost-sensitive environment. Fuel prices fluctuate, maintenance costs rise, delivery delays impact customer satisfaction, and profit margins remain under constant pressure. Therefore, trucking