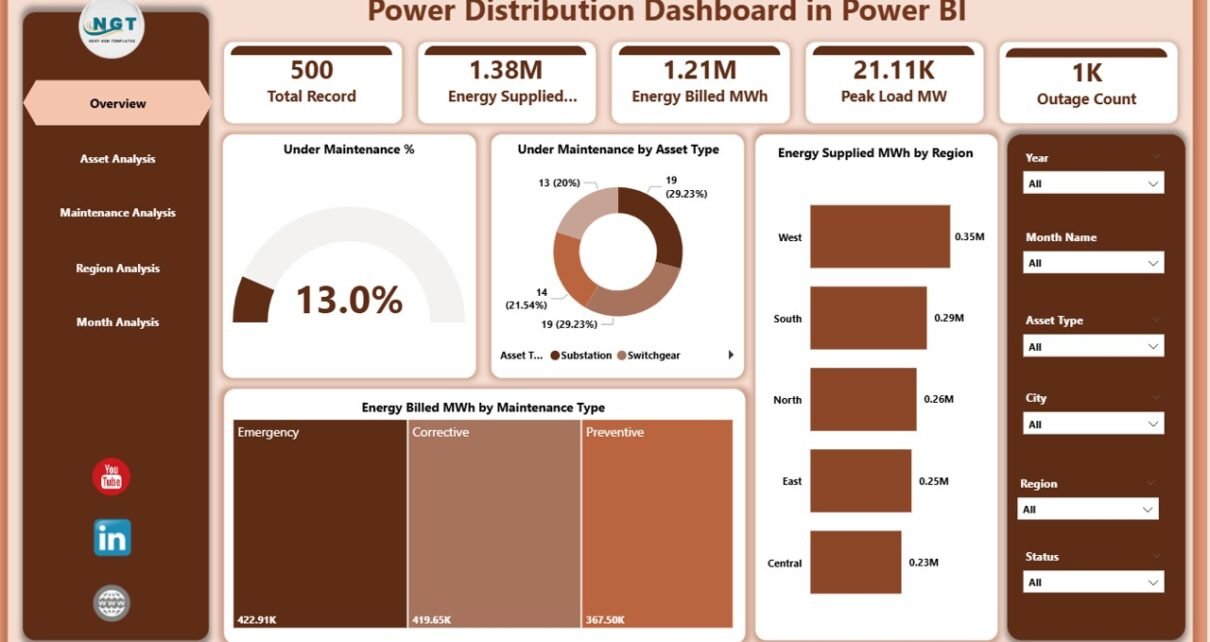
Power Distribution Dashboard in Power BI
Power distribution companies operate in a complex and data-intensive environment. Every day, they manage assets, monitor energy flow, track maintenance activities, handle outages, and ensure reliable electricity delivery. However, when