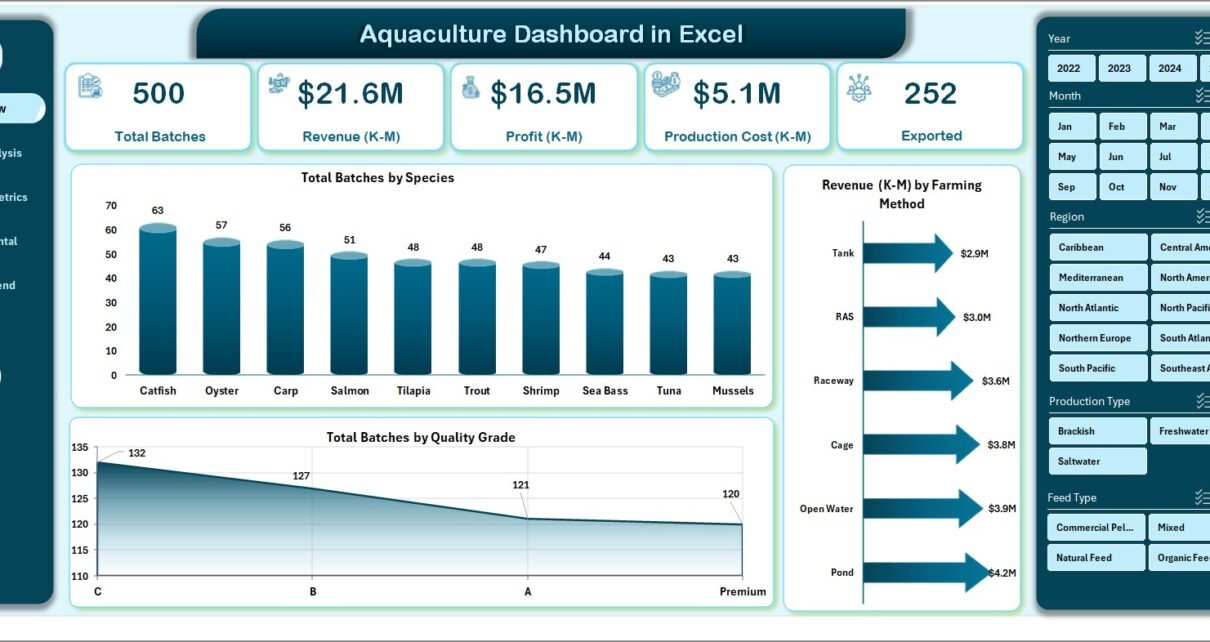
• Excel and VBA
    • VBA Course
    • Shortcut Keys
    • Useful Formulas
    • Basic Charts
    • Advanced Chart
    • Sort and Filter
    • Pivot Table
    • Data Validation
    • Conditional Formatting
    • Auto Fill and Flash Fill
    • Find and Replace
  • DownloadsPopular
    • Excel VBA Tools
    • Dashboard
      • Excel Dashboard
      • KPI Dashboard
      • Power BI Dashboard
    • Charts
      • Progress Charts
      • Info-graphics
      • Animated Charts
      • Comparisons
      • Gantt Charts
      • Heatmaps
      • Speedometers
      • Timelines
    • Inventory Management
    • HR and Payrolls
    • VBA Automation
    • Utilities and Converters
    • Checklist
    • Calendars
    • Data Analysis
    • Excel Templates
    • Financial Tools
    • Project Management
    • Sales and Marketing
    • Productivity
  • Excel Dashboard
  • Templates
  • Tutorials
    • Charts and Visualization
    • VBA
    • Excel Tips and Tricks
  • Power BI
  • Template StoreNew
  • CoursesNew
  • About Us
  • Contact Us

PK: An Excel Expert

Transforming Data into Decisions

Dashboard

This category provides detailed tutorials on creating effective and informative dashboards in Excel. Whether you need to track your business’s key performance indicators (KPIs) or present complex data in a simplified manner, our tutorials will guide you through the process. Each tutorial comes with a free practice file for download and tutorial videos to help you follow along easily. Start your Excel dashboard tutorial now and enhance your data analysis and presentation skills with this powerful tool. Impress your colleagues and boss with insightful and attractive dashboards by exploring this category today.

Dashboard

Hedge Funds Dashboard in Excel

January 24, 2026January 24, 2026 PKComments Off on Hedge Funds Dashboard in Excel
Managing hedge fund data without a structured reporting system often creates confusion, delays, and missed insights. Moreover, when portfolio managers and analysts depend on scattered spreadsheets, decision-making slows down. Therefore,
Read More
Dashboard Power BI

Housing Societies KPI Dashboard in Power BI

January 24, 2026January 24, 2026 PKComments Off on Housing Societies KPI Dashboard in Power BI
Managing a housing society involves continuous monitoring of finances, services, maintenance, compliance, and resident satisfaction. However, many housing societies still depend on manual Excel reports, registers, or scattered data files.
Read More
Dashboard

Housing Societies KPI Dashboard in Excel

January 24, 2026January 24, 2026 PKComments Off on Housing Societies KPI Dashboard in Excel
Managing a housing society involves much more than collecting maintenance fees or resolving complaints. Committees must track finances, services, facilities, compliance, and resident satisfaction regularly. However, when data remains scattered
Read More
Dashboard Power BI

Internal Audit KPI Dashboard in Power BI

January 24, 2026January 24, 2026 PKComments Off on Internal Audit KPI Dashboard in Power BI
Internal audit teams play a critical role in protecting organizations from financial risks, compliance failures, and operational inefficiencies. However, many audit teams still rely on static reports, scattered spreadsheets, and
Read More
Dashboard

Internal Audit KPI Dashboard in Excel

January 24, 2026January 24, 2026 PKComments Off on Internal Audit KPI Dashboard in Excel
Internal audit teams play a critical role in protecting organizations from financial risks, compliance failures, and operational inefficiencies. However, when audit data stays scattered across emails, manual registers, or disconnected
Read More
Dashboard Power BI

Spas and Wellness Centres KPI Dashboard in Power BI

January 23, 2026January 23, 2026 PKComments Off on Spas and Wellness Centres KPI Dashboard in Power BI
Spas and wellness centres focus on delivering relaxation, care, and premium experiences. However, behind the scenes, managers must track performance, control costs, improve customer satisfaction, and grow revenue. When teams
Read More
Dashboard

Spas and Wellness Centres KPI Dashboard in Excel

January 23, 2026January 23, 2026 PKComments Off on Spas and Wellness Centres KPI Dashboard in Excel
Spas and wellness centres operate in a highly competitive and service-driven environment. Every decision—from staff scheduling and treatment utilization to customer satisfaction and revenue growth—directly affects profitability and brand reputation.
Read More
Dashboard Power BI

Executive Search and Staffing Dashboard in Power BI

January 23, 2026January 23, 2026 PKComments Off on Executive Search and Staffing Dashboard in Power BI
Hiring senior leaders and critical talent never works on guesswork. Every executive search firm and staffing agency faces pressure to close roles faster, improve client satisfaction, manage fees, and track
Read More
Dashboard Power BI

Executive Search and Staffing Dashboard in Excel

January 23, 2026January 23, 2026 PKComments Off on Executive Search and Staffing Dashboard in Excel
Recruitment leaders, staffing agencies, and executive search firms face constant pressure to deliver faster placements, maintain high client satisfaction, and control operational delays. However, when teams rely on scattered spreadsheets
Read More
Dashboard Power BI

Credit Unions Dashboard in Power BI

January 23, 2026January 23, 2026 PKComments Off on Credit Unions Dashboard in Power BI
Credit unions operate in a unique space within the financial services industry. They focus on members instead of shareholders, prioritize trust, and aim to deliver value-driven financial products. However, despite
Read More

Posts pagination

Previous 1 … 7 8 9 … 194 Next
  • Excel and VBA
    • VBA Course
    • Shortcut Keys
    • Useful Formulas
    • Basic Charts
    • Advanced Chart
    • Sort and Filter
    • Pivot Table
    • Data Validation
    • Conditional Formatting
    • Auto Fill and Flash Fill
    • Find and Replace
  • DownloadsPopular
    • Excel VBA Tools
    • Dashboard
      • Excel Dashboard
      • KPI Dashboard
      • Power BI Dashboard
    • Charts
      • Progress Charts
      • Info-graphics
      • Animated Charts
      • Comparisons
      • Gantt Charts
      • Heatmaps
      • Speedometers
      • Timelines
    • Inventory Management
    • HR and Payrolls
    • VBA Automation
    • Utilities and Converters
    • Checklist
    • Calendars
    • Data Analysis
    • Excel Templates
    • Financial Tools
    • Project Management
    • Sales and Marketing
    • Productivity
  • Excel Dashboard
  • Templates
  • Tutorials
    • Charts and Visualization
    • VBA
    • Excel Tips and Tricks
  • Power BI
  • Template StoreNew
  • CoursesNew
  • About Us
  • Contact Us
Copyright © 2023 PK-AnExcelExpert.com - Privacy Policy
This website uses cookies to improve your user experience, analyze site traffic and serve targeted ads in accordance with our Privacy Policy ACCEPT
Privacy & Cookies Policy

Privacy Overview

This website uses cookies to improve your experience while you navigate through the website. Out of these cookies, the cookies that are categorized as necessary are stored on your browser as they are essential for the working of basic functionalities of the website. We also use third-party cookies that help us analyze and understand how you use this website. These cookies will be stored in your browser only with your consent. You also have the option to opt-out of these cookies. But opting out of some of these cookies may have an effect on your browsing experience.
Necessary
Always Enabled
Necessary cookies are absolutely essential for the website to function properly. This category only includes cookies that ensures basic functionalities and security features of the website. These cookies do not store any personal information.
Non-necessary
Any cookies that may not be particularly necessary for the website to function and is used specifically to collect user personal data via analytics, ads, other embedded contents are termed as non-necessary cookies. It is mandatory to procure user consent prior to running these cookies on your website.
SAVE & ACCEPT