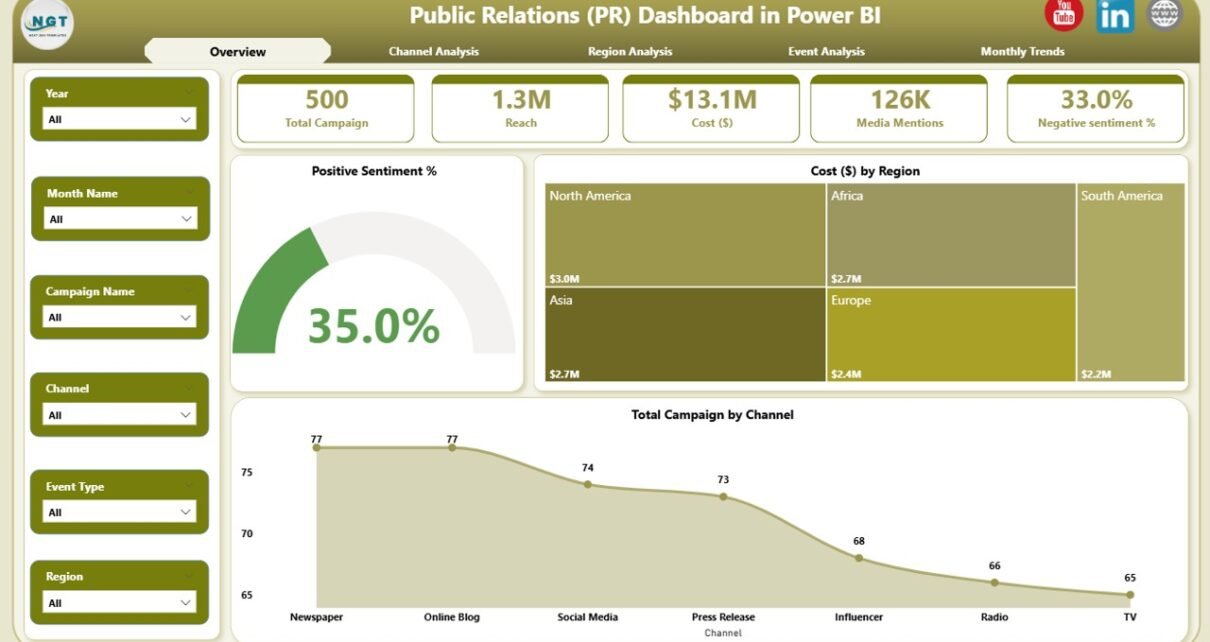
Public Relations (PR) Dashboard in Power BI
In today’s fast-moving digital era, Public Relations (PR) plays a key role in shaping brand image, driving engagement, and maintaining credibility. Every campaign, event, and media mention contributes to how