Managing credit risk requires clarity, accuracy, and timely insights. However, many finance teams still depend on scattered spreadsheets, static reports, and manual calculations. As a result, decision-making becomes slow and reactive.
That is exactly where a Credit Rating Agencies Dashboard in Excel delivers real value.
In this detailed guide, you will learn what a Credit Rating Agencies Dashboard in Excel is, why it matters, how it works, its page-wise features, advantages, best practices, and frequently asked questions. By the end of this article, you will clearly understand how this ready-to-use Excel dashboard improves credit risk monitoring, exposure analysis, and strategic decision-making.
Click to Purchases Credit Rating Agencies Dashboard in Excel
What Is a Credit Rating Agencies Dashboard in Excel?
A Credit Rating Agencies Dashboard in Excel is an interactive and centralized reporting tool designed to analyze credit ratings, exposure, probability of default, debt, and revenue across agencies, industries, countries, and time periods.
Instead of reviewing multiple Excel files or lengthy reports, this dashboard consolidates all key credit-related metrics into a single, easy-to-use interface. Moreover, it allows users to filter, compare, and monitor credit performance using dynamic slicers and visual charts.
As a result, finance professionals gain faster insights and stronger control over credit risk.
Why Is a Credit Rating Agencies Dashboard in Excel Important?
Credit ratings influence lending decisions, investment strategies, and regulatory compliance. Therefore, tracking rating changes and exposure trends becomes critical.
Here is why this dashboard matters:
-
It improves visibility into credit exposure and default risk
-
It enables faster and data-driven decisions
-
It reduces manual reporting effort
-
It enhances transparency for stakeholders
-
It supports risk mitigation and portfolio optimization
Because Excel remains widely used across finance teams, this dashboard fits perfectly into existing workflows.
How Does a Credit Rating Agencies Dashboard in Excel Work?
This dashboard works by connecting structured credit data to interactive Excel visuals. First, users store raw data in a dedicated Data Sheet. Then, pivot tables and pivot charts transform that data into insights.
Additionally, slicers placed on the right side of each page allow users to filter data by agency, industry, country, or month. A Page Navigator on the left side enables smooth navigation across all analytical pages.
As a result, users explore data effortlessly without writing complex formulas.
What Are the Core Components of This Dashboard?
The Credit Rating Agencies Dashboard in Excel includes the following core components:
-
Page Navigator for quick page switching
-
Overview and Analysis Pages for multi-dimensional insights
-
Dynamic Slicers for real-time filtering
-
KPI Cards for instant performance tracking
-
Pivot Charts for visual analysis
-
Support Sheet for backend calculations
-
Data Sheet for structured data storage
Together, these components create a powerful yet user-friendly reporting system.
What Pages Are Included in the Credit Rating Agencies Dashboard in Excel?
This ready-to-use dashboard includes five analytical pages, each designed to answer specific business questions.
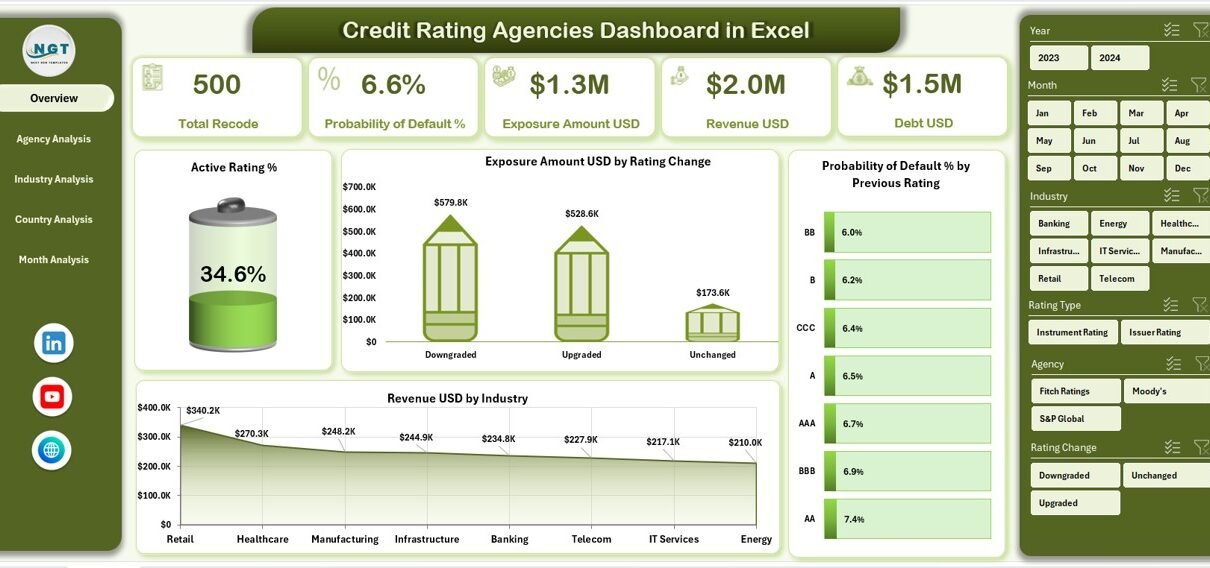
What Does the Overview Page Show?
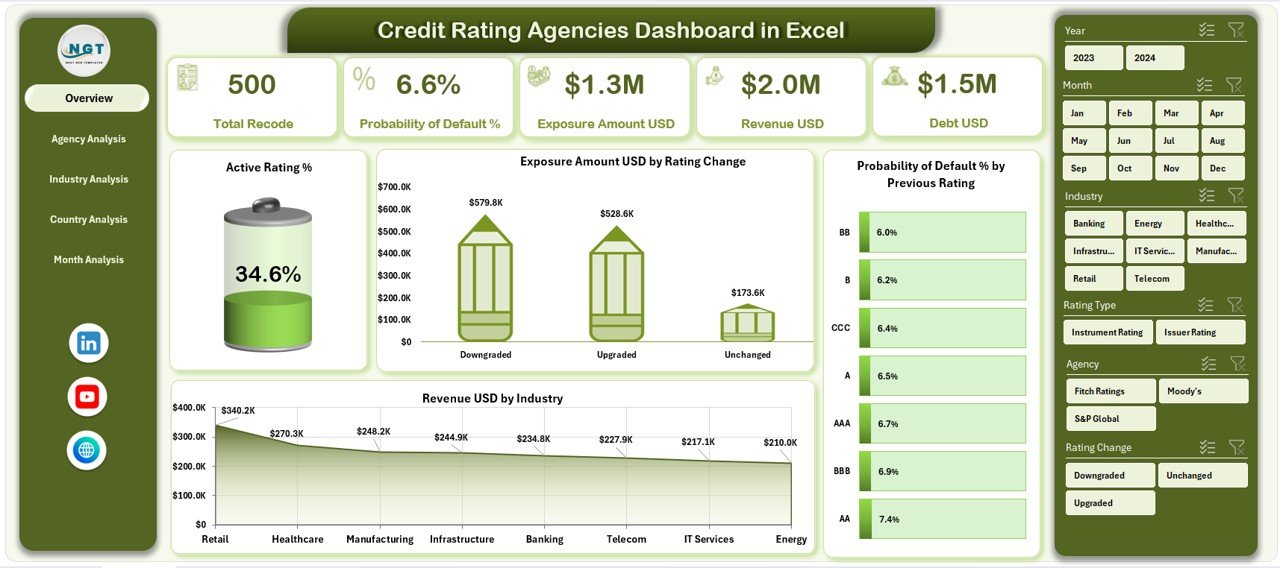
The Overview Page acts as the control center of the dashboard. It provides a high-level summary of credit performance across the portfolio.
Key Features of the Overview Page
-
Right-side slicers for quick filtering
-
Four KPI cards for instant insights
-
Four critical charts for risk and exposure analysis
Charts Available on the Overview Page
-
Active Rating %
-
Exposure Amount (USD) by Rating Change
-
Probability of Default % by Previous Rating
-
Revenue (USD) by Industry
Because this page delivers a snapshot of overall performance, managers can identify risk trends immediately.
Click to Purchases Credit Rating Agencies Dashboard in Excel
How Does the Agency Analysis Page Help?
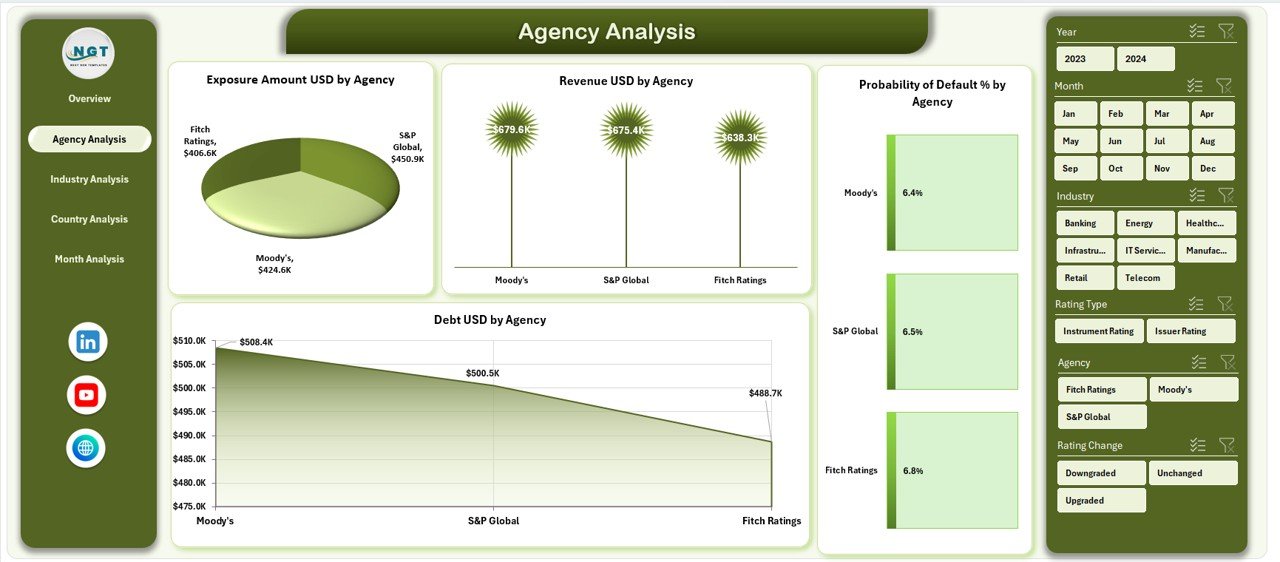
The Agency Analysis Page focuses on performance comparison across different credit rating agencies.
Key Features of the Agency Analysis Page
-
Right-side slicers for agency-level filtering
-
Four detailed charts for agency comparison
Charts Included
-
Exposure Amount (USD) by Agency
-
Revenue (USD) by Agency
-
Probability of Default % by Agency
-
Debt (USD) by Agency
With this view, users quickly identify which agencies carry higher exposure or default risk.
What Insights Does the Industry Analysis Page Provide?
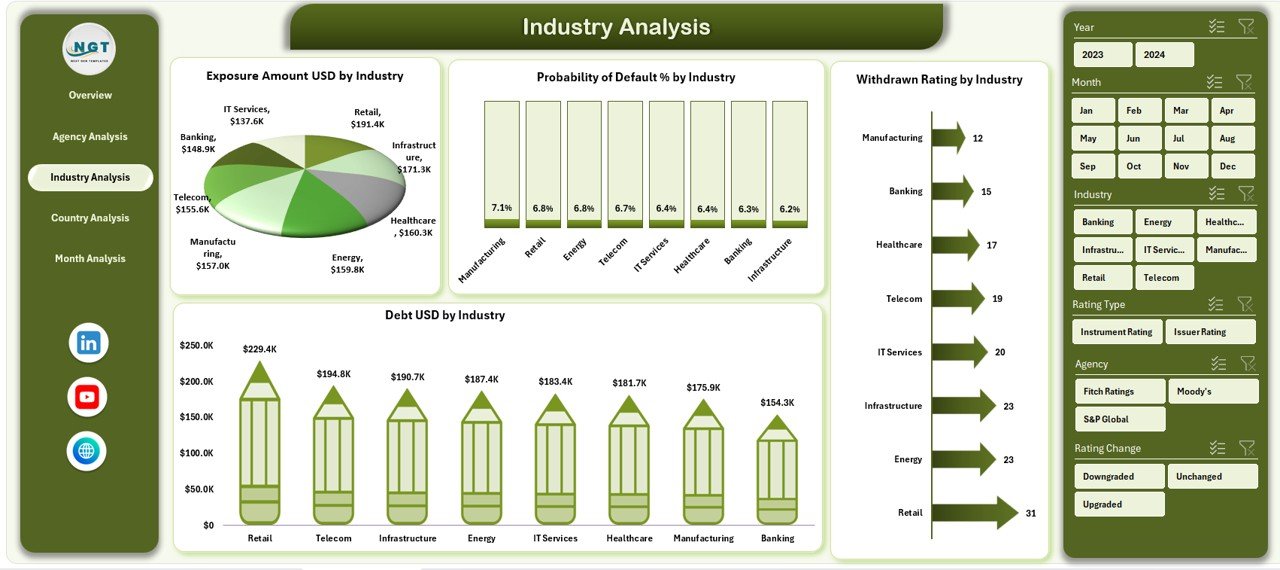
The Industry Analysis Page highlights credit risk and exposure patterns across industries.
Key Features of the Industry Analysis Page
-
Right-side slicers for industry selection
-
Four industry-focused charts
Charts Included
-
Exposure Amount (USD) by Industry
-
Probability of Default % by Industry
-
Debt (USD) by Industry
-
Withdrawn Rating by Industry
Because industry risk varies significantly, this page supports smarter sector-level decisions.
Why Is the Country Analysis Page Useful?
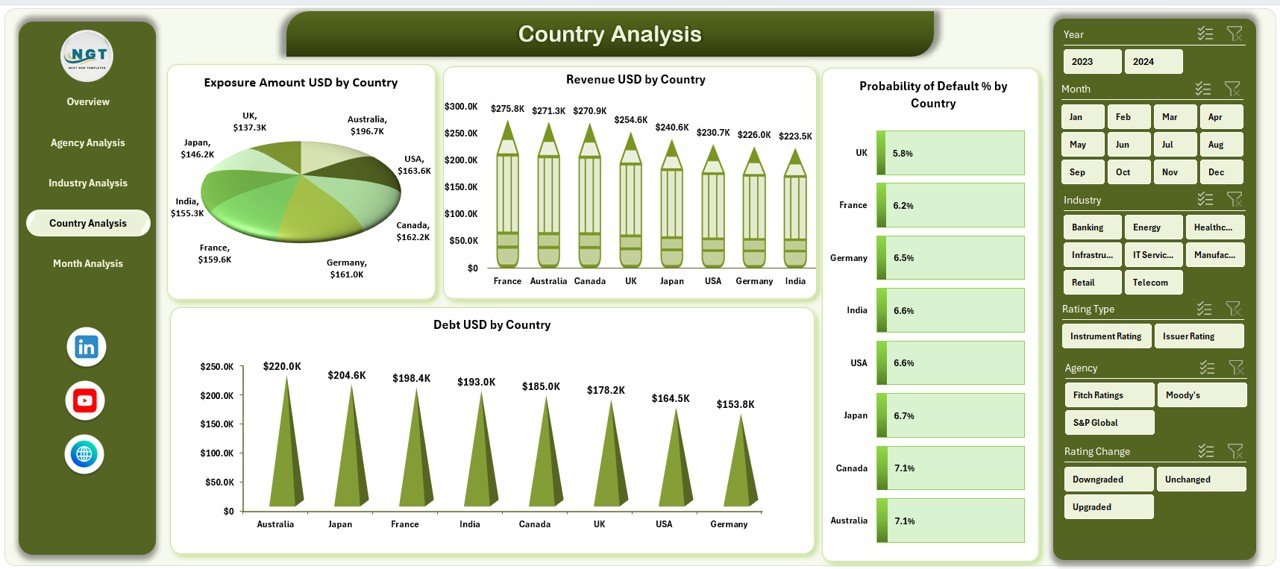
The Country Analysis Page enables geographic risk assessment.
Key Features of the Country Analysis Page
-
Right-side slicers for country filtering
-
Four country-based charts
Charts Included
-
Exposure Amount (USD) by Country
-
Probability of Default % by Country
-
Debt (USD) by Country
-
Revenue (USD) by Country
As a result, organizations identify high-risk regions and adjust strategies accordingly.
What Does the Month Analysis Page Reveal?
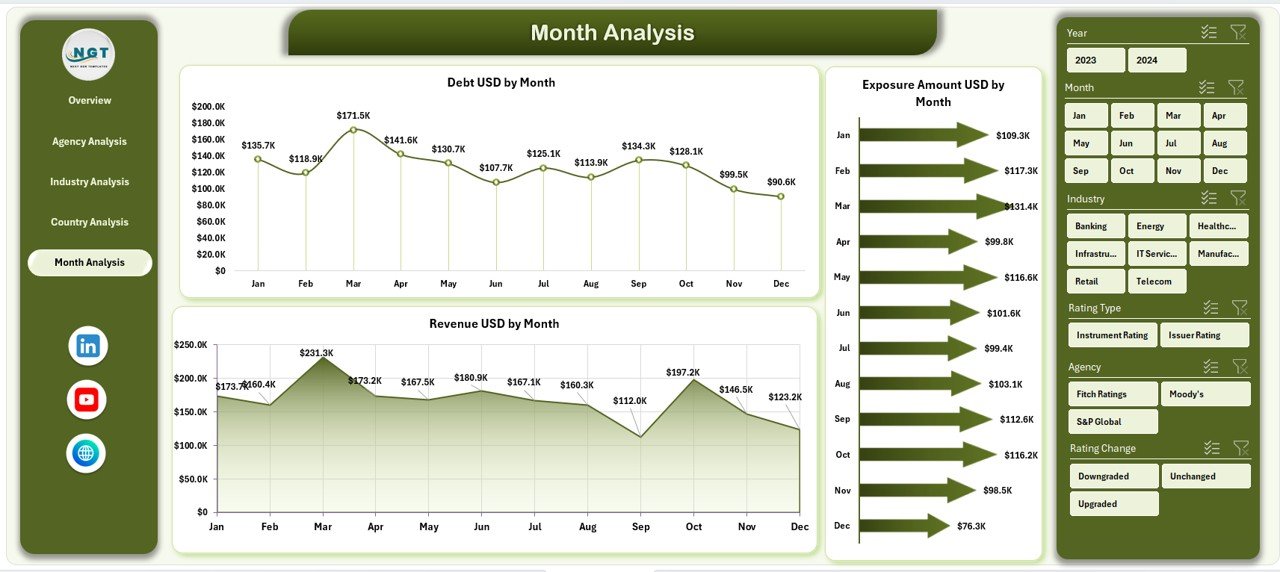
The Month Analysis Page tracks trends over time.
Key Features of the Month Analysis Page
-
Right-side slicers for time filtering
-
Three time-based trend charts
Charts Included
-
Exposure Amount (USD) by Month
-
Debt (USD) by Month
-
Revenue (USD) by Month
Because trends matter in risk management, this page highlights seasonal patterns and emerging risks.
Click to Purchases Credit Rating Agencies Dashboard in Excel
What Is the Role of the Support Sheet?
The Support Sheet works behind the scenes. It stores helper calculations, intermediate tables, and mappings required for pivot charts and slicers.
Although users rarely interact with this sheet, it ensures smooth dashboard performance.
Why Is the Data Sheet So Important?
The Data Sheet acts as the backbone of the dashboard.
Key Characteristics of the Data Sheet
-
Structured and normalized format
-
Consistent data types for dates and amounts
-
One-row-per-record design
-
Ready for pivot table analysis
By maintaining clean data here, users ensure accurate insights across all dashboard pages.
Advantages of Credit Rating Agencies Dashboard in Excel
Using this dashboard delivers multiple business benefits.
Key Advantages
-
Centralized Reporting: All credit metrics in one place
-
Time Savings: Faster analysis with pivot-based visuals
-
Improved Accuracy: Reduced manual errors
-
Better Risk Visibility: Clear view of exposure and default risk
-
User-Friendly: No advanced Excel skills required
-
Customizable: Easy to extend with new metrics
Because of these advantages, finance teams gain confidence in their decisions.
Who Should Use a Credit Rating Agencies Dashboard in Excel?
This dashboard suits multiple roles and industries.
Ideal Users
-
Credit risk analysts
-
Financial institutions
-
Investment firms
-
Corporate finance teams
-
Risk management professionals
-
Portfolio managers
If your role involves credit evaluation or exposure monitoring, this dashboard fits perfectly.
How Can This Dashboard Improve Decision-Making?
This dashboard improves decision-making by:
-
Highlighting high-risk agencies and industries
-
Tracking rating changes over time
-
Monitoring exposure concentration
-
Comparing revenue versus risk
-
Supporting proactive risk mitigation
Because insights update instantly through slicers, decisions stay timely and relevant.
Best Practices for the Credit Rating Agencies Dashboard in Excel
To maximize dashboard value, follow these best practices.
1. Maintain Clean and Updated Data
Always validate and refresh the Data Sheet regularly.
2. Use Consistent Rating Categories
Ensure rating names remain standardized across records.
3. Limit Manual Formula Changes
Rely on pivot tables instead of hard-coded formulas.
4. Protect Support and Data Sheets
Apply sheet protection to avoid accidental edits.
5. Review Trends Monthly
Use the Month Analysis page to detect early warning signals.
6. Customize Charts as Needed
Adjust visuals based on stakeholder requirements.
By following these practices, the dashboard remains reliable and scalable.
Common Challenges and How to Overcome Them
Even powerful dashboards face challenges.
Challenge 1: Inconsistent Data Formats
Solution: Enforce data validation rules.
Challenge 2: Slow Performance with Large Data
Solution: Optimize pivot tables and remove unused fields.
Challenge 3: Misinterpretation of Risk Metrics
Solution: Add clear definitions in the Support Sheet.
Because these challenges have simple solutions, adoption becomes easier.
How Is This Dashboard Different from Traditional Reports?
Unlike static reports, this dashboard:
-
Updates dynamically with slicers
-
Supports multi-dimensional analysis
-
Reduces reporting turnaround time
-
Encourages exploration and insights
Therefore, it transforms reporting into decision support.
Conclusion
A Credit Rating Agencies Dashboard in Excel transforms complex credit data into clear, actionable insights. It centralizes exposure, default risk, debt, and revenue metrics across agencies, industries, countries, and time periods.
Moreover, its interactive design, pivot-based visuals, and structured layout make it ideal for finance professionals who seek accuracy and efficiency. By using this dashboard, organizations strengthen risk management, improve transparency, and make smarter credit decisions.
Frequently Asked Questions (FAQs)
Click to Purchases Credit Rating Agencies Dashboard in Excel
What is a Credit Rating Agencies Dashboard in Excel?
It is an interactive Excel-based tool that analyzes credit ratings, exposure, default risk, debt, and revenue using charts and slicers.
Can beginners use this dashboard?
Yes, the dashboard uses pivot tables and slicers, so beginners can use it easily without advanced Excel skills.
Does this dashboard support customization?
Yes, users can add new charts, metrics, or filters as per business needs.
How often should the data be updated?
Ideally, users should update the data monthly or whenever new credit information becomes available.
Is this dashboard suitable for large datasets?
Yes, with optimized pivot tables and clean data, it handles large datasets efficiently.
Can this dashboard replace manual credit reports?
Yes, it significantly reduces manual reporting and improves analytical depth.
Visit our YouTube channel to learn step-by-step video tutorials