Managing export compliance without clear visibility always creates risk, delays, and unnecessary penalties. Moreover, regulatory requirements keep changing, which makes compliance tracking even more complex. Therefore, organizations that rely on scattered Excel sheets, emails, and manual reports often struggle to stay audit-ready.
That is exactly where an Export Compliance KPI Dashboard in Power BI becomes a powerful and practical solution.
In this detailed article, you will learn what an Export Compliance KPI Dashboard in Power BI is, how it works, why organizations need it, its complete page-wise structure, key KPIs, advantages, best practices, and frequently asked questions. Additionally, the explanations remain simple, actionable, and easy to implement for real business use.
Click to Purchases Export Compliance KPI Dashboard in Power BI
What Is an Export Compliance KPI Dashboard in Power BI?
An Export Compliance KPI Dashboard in Power BI is a centralized performance monitoring system that tracks export-related compliance metrics using interactive visuals, slicers, KPIs, and trend charts.
Instead of reviewing multiple compliance reports separately, this dashboard brings everything together into one powerful interface built using Microsoft Power BI. As a result, compliance managers, export teams, and auditors gain instant visibility into performance, risks, and regulatory adherence.
Because this dashboard uses Power BI with an Excel data source, it stays flexible, scalable, and business-friendly. You update the Excel file, refresh the dashboard, and immediately see updated compliance insights.
Why Do Organizations Need an Export Compliance KPI Dashboard?
Export compliance directly affects business continuity, brand reputation, and financial stability. However, many organizations still track compliance manually, which increases the chance of errors.
Here is why an Export Compliance KPI Dashboard becomes essential:
-
First, it provides real-time visibility into compliance performance
-
Second, it reduces manual tracking and reporting efforts
-
Third, it highlights target deviations instantly
-
Moreover, it supports audit readiness and regulatory reporting
-
Finally, it enables data-driven compliance decisions
Therefore, organizations that export goods, services, or technology benefit greatly from a structured KPI dashboard.
How Does the Export Compliance KPI Dashboard in Power BI Work?
The Export Compliance KPI Dashboard works on a simple yet powerful flow:
-
Data Entry in Excel
You enter Actual and Target KPI values in structured Excel sheets. -
Power BI Data Model
Power BI connects to the Excel file and models the data. -
Interactive Dashboard Pages
Users analyze KPIs using slicers, tables, icons, and trend charts. -
Drill-Through Analysis
Users drill into KPI definitions and formulas for clarity.
Because of this design, even non-technical users can operate the dashboard confidently.
What Are the Key Pages in the Export Compliance KPI Dashboard in Power BI?
This ready-to-use dashboard contains three well-structured pages, each designed for a specific analytical purpose.
1. What Does the Summary Page Show?
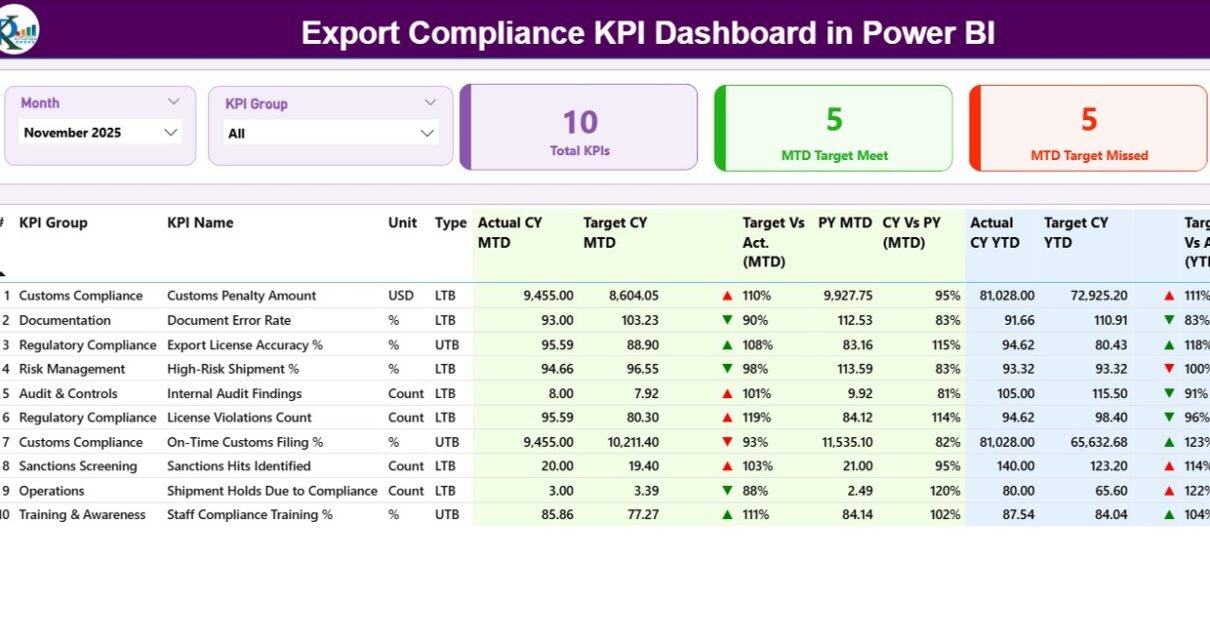
The Summary Page acts as the control center of the entire dashboard. It provides a high-level overview of all export compliance KPIs.
Top Section: Filters and KPI Cards
At the top of the page, you will find:
-
Month Slicer – Select the reporting month
-
KPI Group Slicer – Filter KPIs by category
Along with slicers, the dashboard displays three important KPI cards:
-
Total KPIs Count
-
MTD Target Met Count
-
MTD Target Missed Count
These cards instantly tell you how compliance is performing for the selected month.
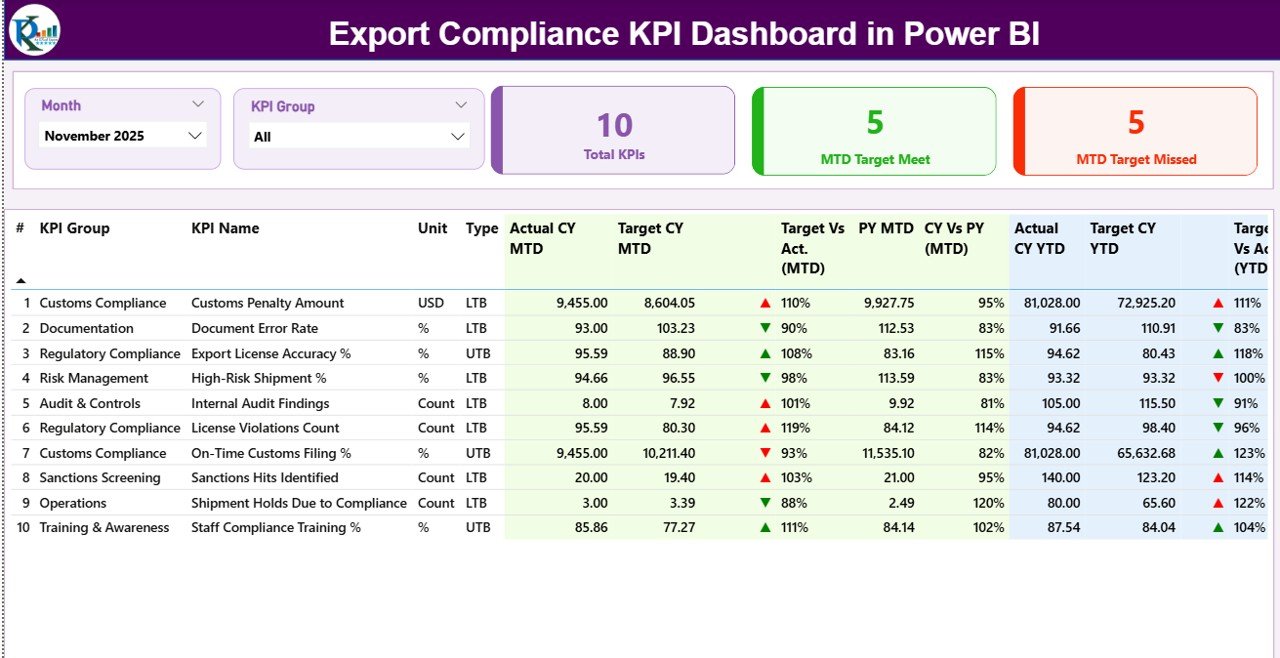
Detailed KPI Table: Complete Performance View
Below the cards, the Summary Page displays a detailed KPI table with rich insights.
Columns Included in the Table
-
KPI Number – Sequential number of KPIs
-
KPI Group – Category or compliance area
-
KPI Name – Name of the compliance metric
-
Unit – Measurement unit
-
Type – LTB (Lower the Better) or UTB (Upper the Better)
MTD (Month-to-Date) Metrics
-
Actual CY MTD
-
Target CY MTD
-
MTD Icon (▲ green / ▼ red)
-
Target vs Actual (MTD %)
-
PY MTD
-
CY vs PY (MTD %)
YTD (Year-to-Date) Metrics
-
Actual CY YTD
-
Target CY YTD
-
YTD Icon (▲ green / ▼ red)
-
Target vs Actual (YTD %)
-
PY YTD
-
CY vs PY (YTD %)
Because of this structure, users can immediately identify compliance gaps and improvements.
2. How Does the KPI Trend Page Help?
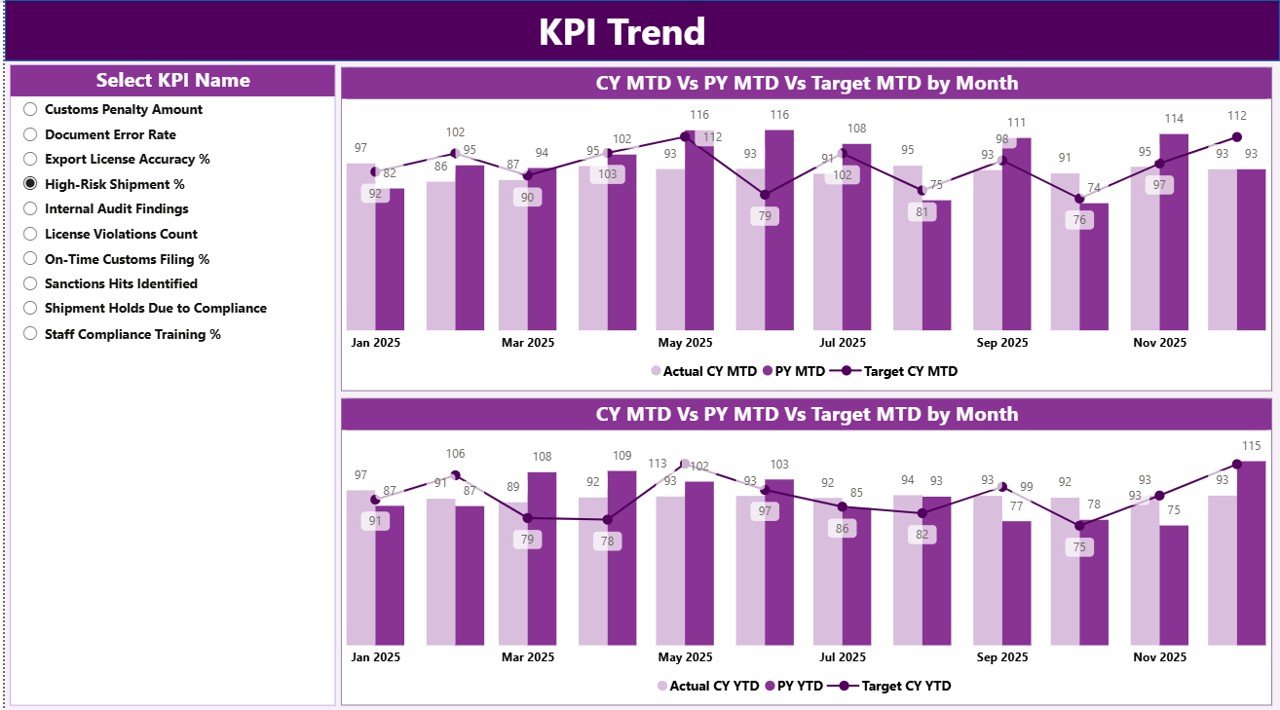
The KPI Trend Page focuses on performance trends rather than snapshots.
Key Features of the KPI Trend Page
-
KPI Name slicer on the left
-
Two combo charts:
-
MTD trend (Actual CY, PY, Target)
-
YTD trend (Actual CY, PY, Target)
-
These charts clearly show how compliance performance changes over time.
As a result, compliance managers can:
-
Identify recurring compliance issues
-
Compare current performance with previous years
-
Evaluate whether targets remain realistic
Therefore, this page supports proactive compliance management.
3. What Is the Purpose of the KPI Definition Page?
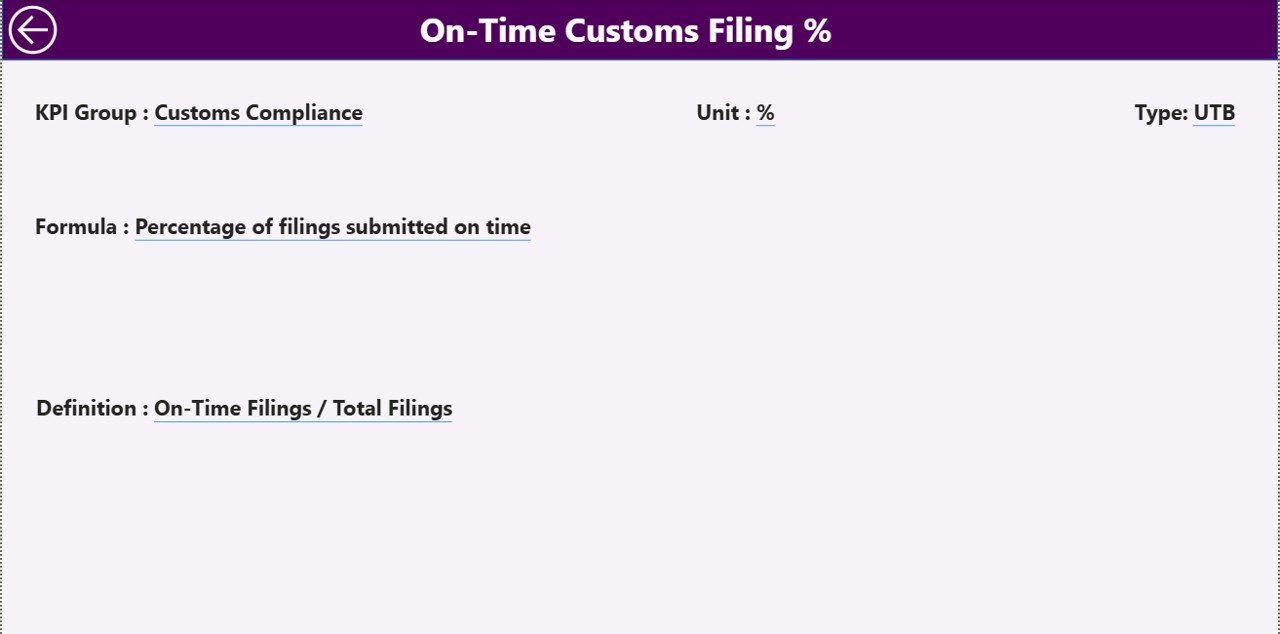
The KPI Definition Page provides complete clarity about each KPI.
Key Characteristics
-
Hidden drill-through page
-
Accessible from the Summary Page
-
Displays:
-
KPI Formula
-
KPI Definition
-
KPI Type
-
Users can easily drill through from any KPI row to understand how values are calculated.
Moreover, a Back Button on the top-left corner allows instant navigation back to the Summary Page.
How Does the Excel Data Source Support This Dashboard?
The Export Compliance KPI Dashboard uses a structured Excel file as its data source. This design keeps data entry simple and transparent.
What Are the Excel Sheets Used in the Dashboard?
1. Input_Actual Sheet
In this sheet, you enter:
-
KPI Name
-
Month (first date of the month)
-
MTD Actual Value
-
YTD Actual Value
This sheet captures real performance numbers.
2. Input_Target Sheet
In this sheet, you enter:
-
KPI Name
-
Month (first date of the month)
-
MTD Target Value
-
YTD Target Value
This sheet defines expected compliance targets.
3. KPI Definition Sheet
This sheet stores master data:
-
KPI Number
-
KPI Group
-
KPI Name
-
Unit
-
Formula
-
Definition
-
Type (LTB or UTB)
Because of this separation, data maintenance becomes easy and error-free.
Click to Purchases Export Compliance KPI Dashboard in Power BI
What KPIs Can You Track in an Export Compliance Dashboard?
Organizations can track many export compliance KPIs, such as:
-
Export License Compliance Rate
-
Documentation Accuracy %
-
Shipment Delay Incidents
-
Regulatory Audit Findings
-
Penalty Incidents Count
-
Screening Compliance Rate
-
Customs Clearance Accuracy
-
Restricted Party Screening Errors
You can easily add or modify KPIs without changing the dashboard structure.
Advantages of Export Compliance KPI Dashboard in Power BI
Why Should Organizations Use This Dashboard?
-
📊 Centralized compliance visibility
-
⚡ Instant target vs actual insights
-
📈 Clear MTD and YTD trend analysis
-
🧭 Easy drill-through for KPI understanding
-
🔄 Excel-based data entry with Power BI visuals
-
🛡️ Improved audit readiness
-
📉 Early detection of compliance risks
Therefore, this dashboard transforms compliance from reactive to proactive.
Who Can Benefit from an Export Compliance KPI Dashboard?
This dashboard works perfectly for:
-
Export compliance officers
-
Trade compliance managers
-
Logistics and shipping teams
-
Risk and audit departments
-
Export operations managers
-
Senior leadership teams
Because the visuals remain simple, both operational and executive users benefit equally.
Best Practices for the Export Compliance KPI Dashboard in Power BI
To get maximum value from the dashboard, follow these best practices:
1. Define KPIs Clearly
Always document KPI formulas and definitions in the KPI Definition sheet.
2. Use Consistent Units
Ensure units remain consistent across Actual and Target sheets.
3. Update Data Monthly
Refresh Actual and Target data regularly to keep insights accurate.
4. Validate Data Before Refresh
Check Excel entries before refreshing Power BI to avoid errors.
5. Focus on Actionable KPIs
Track KPIs that directly influence compliance decisions.
6. Review Trends, Not Just Numbers
Use the KPI Trend Page to identify long-term compliance patterns.
How Does This Dashboard Improve Decision-Making?
Because the dashboard combines targets, actuals, trends, and comparisons, decision-makers can:
-
Prioritize high-risk compliance areas
-
Allocate resources effectively
-
Adjust compliance targets realistically
-
Improve audit preparation strategies
As a result, compliance becomes measurable, visible, and manageable.
Conclusion
An Export Compliance KPI Dashboard in Power BI delivers clarity, control, and confidence to organizations managing export regulations. Instead of reacting to compliance issues, teams gain the ability to monitor performance proactively, identify risks early, and maintain audit readiness at all times.
Because the dashboard uses structured Excel inputs, interactive Power BI visuals, MTD and YTD comparisons, trend charts, and drill-through definitions, it becomes a complete compliance performance solution.
If your organization wants to strengthen export compliance while reducing manual effort, this dashboard offers the perfect starting point.
Frequently Asked Questions (FAQs)
What is an Export Compliance KPI Dashboard in Power BI?
It is an interactive dashboard that tracks export compliance KPIs using Power BI visuals and Excel data.
Can I customize KPIs in this dashboard?
Yes, you can easily add or modify KPIs using the KPI Definition and input sheets.
Does the dashboard support MTD and YTD analysis?
Yes, it displays both MTD and YTD Actual, Target, and Previous Year comparisons.
Is Excel required for data input?
Yes, the dashboard uses Excel as its primary data source.
Can non-technical users use this dashboard?
Yes, the dashboard design remains user-friendly and intuitive.
Does it support audit readiness?
Absolutely. The dashboard improves traceability, visibility, and compliance tracking for audits.
Visit our YouTube channel to learn step-by-step video tutorials