In today’s healthcare environment, neurology hospitals manage complex operations every single day. From patient care quality to treatment timelines, hospitals must monitor multiple performance indicators continuously. However, when teams rely on scattered data sources, they often struggle to track performance accurately. As a result, decision-making slows down, and patient outcomes may suffer.
So, how can neurology hospitals track KPIs effectively and improve operational performance?
👉 The answer is the Neurology Hospitals KPI Dashboard in Power BI.
This ready-to-use and interactive dashboard helps hospitals monitor, analyze, and optimize their key performance indicators (KPIs) in one centralized platform. Moreover, it transforms raw data into actionable insights using dynamic visuals, comparisons, and trend analysis.
In this detailed guide, you will learn everything about this dashboard, including features, structure, advantages, best practices, and FAQs.
📊 What is a Neurology Hospitals KPI Dashboard in Power BI?
Click to Buy Neurology Hospitals KPI Dashboard in Power BI
A Neurology Hospitals KPI Dashboard in Power BI is an advanced reporting tool designed to track and evaluate hospital performance metrics related to neurology departments.
Instead of managing multiple reports, you can use this dashboard to:
-
Monitor KPI performance in real time
-
Compare actual vs target values
-
Analyze trends over time
-
Improve patient care quality
-
Enhance operational efficiency
Moreover, Power BI enables interactive filtering and drill-through features. Therefore, users can explore detailed insights easily.
🤔 Why Do Neurology Hospitals Need a KPI Dashboard?
Neurology hospitals deal with critical cases that require timely decisions. However, without proper KPI tracking, hospitals may face delays, inefficiencies, and lack of transparency.
With this dashboard, you can:
-
Improve treatment efficiency
-
Track patient care performance
-
Reduce delays in diagnosis and treatment
-
Monitor departmental efficiency
-
Enhance decision-making
Therefore, it becomes an essential tool for modern healthcare institutions.
🧩 Key Features of Neurology Hospitals KPI Dashboard in Power BI
Click to Buy Neurology Hospitals KPI Dashboard in Power BI
This dashboard includes 3 powerful pages, each designed to provide comprehensive insights.
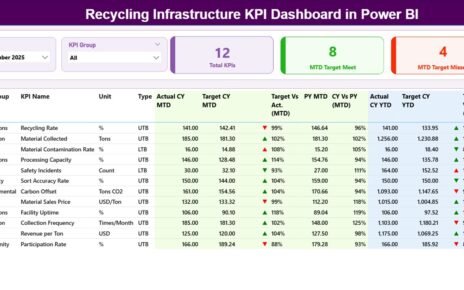
1️⃣ Summary Page – Central Performance Overview 📌
The Summary Page is the main control panel of the dashboard.
🔹 Slicers:
-
Month Selector
-
KPI Group Selector
🔢 KPI Cards:
-
Total KPI Count
-
MTD Target Met Count
-
MTD Target Missed Count
📋 Detailed KPI Table Includes:
-
KPI Number
-
KPI Group
-
KPI Name
-
Unit
-
KPI Type (LTB – Lower the Better / UTB – Upper the Better)
📊 MTD Metrics:
-
Actual CY MTD
-
Target CY MTD
-
MTD Status Indicator (▲ / ▼ with color)
-
Target vs Actual % (MTD)
-
Previous Year MTD
-
CY vs PY % (MTD)
📊 YTD Metrics:
-
Actual CY YTD
-
Target CY YTD
-
YTD Status Indicator (▲ / ▼)
-
Target vs Actual % (YTD)
-
Previous Year YTD
-
CY vs PY % (YTD)
👉 As a result, decision-makers get a complete snapshot of performance instantly.

Click to Buy Neurology Hospitals KPI Dashboard in Power BI
2️⃣ KPI Trend Page – Visual Performance Tracking 📈
The KPI Trend Page helps you analyze performance trends visually.
🔹 Features:
-
KPI Selection Slicer
-
Two Combo Charts for:
-
MTD Trends (Actual vs Target vs Previous Year)
-
YTD Trends (Actual vs Target vs Previous Year)
-
👉 Therefore, users can easily identify trends and performance gaps.

Click to Buy Neurology Hospitals KPI Dashboard in Power BI
3️⃣ KPI Definition Page – Detailed KPI Insights 📘
This is a drill-through page that provides detailed KPI information.
🔹 Includes:
-
KPI Formula
-
KPI Definition
-
KPI Type
-
KPI Group
👉 Users can access this page from the Summary Page and return using the back button.

Click to Buy Neurology Hospitals KPI Dashboard in Power BI
📂 Excel Data Structure Used in Dashboard
This dashboard uses an Excel file as a data source, making it easy to maintain.
📊 1. Input_Actual Sheet
-
KPI Name
-
Month (First date of month)
-
MTD Values
-
YTD Values

Click to Buy Neurology Hospitals KPI Dashboard in Power BI
🎯 2. Input_Target Sheet
-
KPI Name
-
Month
-
MTD Target
-
YTD Target

📘 3. KPI Definition Sheet
-
KPI Number
-
KPI Group
-
KPI Name
-
Unit
-
Formula
-
Definition
-
Type (LTB / UTB)
👉 Therefore, you can easily manage and update data.

Click to Buy Neurology Hospitals KPI Dashboard in Power BI
🚀 Advantages of Neurology Hospitals KPI Dashboard in Power BI
✅ Better Decision-Making
-
Real-time KPI monitoring
-
Clear visual insights
-
Faster actions
✅ Improved Patient Care
-
Track treatment performance
-
Reduce delays
-
Improve outcomes
✅ Increased Efficiency
-
Optimize hospital operations
-
Reduce resource wastage
✅ Data Transparency
-
Clear KPI tracking
-
Improved accountability
✅ Easy Data Management
-
Excel-based input
-
Simple updates
📈 How Does This Dashboard Improve Hospital Performance?
Click to Buy Neurology Hospitals KPI Dashboard in Power BI
When hospitals track KPIs effectively:
-
Patient care improves
-
Operational efficiency increases
-
Costs reduce
-
Staff productivity increases
Therefore, overall hospital performance improves significantly.
🛠️ Best Practices for Neurology Hospitals KPI Dashboard
🔹 Maintain Accurate Data
-
Avoid errors in input sheets
-
Ensure consistent data entry
🔹 Define Clear KPIs
-
Use relevant healthcare metrics
-
Align KPIs with goals
🔹 Update Data Regularly
-
Keep dashboard current
-
Avoid outdated insights
🔹 Use Drill-Through Features
-
Analyze KPI details
-
Understand root causes
🔹 Train Staff
-
Ensure proper usage
-
Promote data-driven culture
How to Use the Dashboard Effectively?
Click to Buy Neurology Hospitals KPI Dashboard in Power BI
-
Enter actual data in Excel
-
Input targets and definitions
-
Refresh Power BI dashboard
-
Use slicers to filter data
-
Analyze KPIs and trends
👉 As a result, you can improve hospital performance.
-
Automated alerts
Therefore, healthcare analytics will become more advanced.
🏁 Conclusion
Click to Buy Neurology Hospitals KPI Dashboard in Power BI
The Neurology Hospitals KPI Dashboard in Power BI is a powerful tool that helps hospitals monitor performance, improve patient care, and make smarter decisions.
By using this dashboard, you can:
-
Track KPIs effectively
-
Improve operational efficiency
-
Enhance patient outcomes
Therefore, it is a must-have solution for modern healthcare management.
Visit our YouTube channel to learn step-by-step video tutorials
Youtube.com/@NeotechNavigators
Click to Buy Neurology Hospitals KPI Dashboard in Power BI