In today’s fast-paced data-driven world, managing satellite imaging KPIs (Key Performance Indicators) has become essential for industries like geospatial analytics, defense, agriculture, climate monitoring, and more. To make this process seamless, we’ve designed a ready-to-use Satellite Imaging KPI Dashboard in Excel.
This article will take you through everything you need to know—from its features and advantages to best practices and frequently asked questions. So, buckle up as we explore how Excel can transform your satellite imaging KPI tracking like never before!
Click to Purchase Satellite Imaging KPI Dashboard in Excel
What Is a Satellite Imaging KPI Dashboard in Excel?
A Satellite Imaging KPI Dashboard in Excel is a dynamic, interactive tool designed to help teams and organizations monitor, track, and evaluate the performance of satellite imaging activities.
Instead of juggling multiple reports, this dashboard brings all critical metrics together in one place using Excel’s powerful features like drop-down menus, conditional formatting, dynamic charts, and inter-sheet navigation.
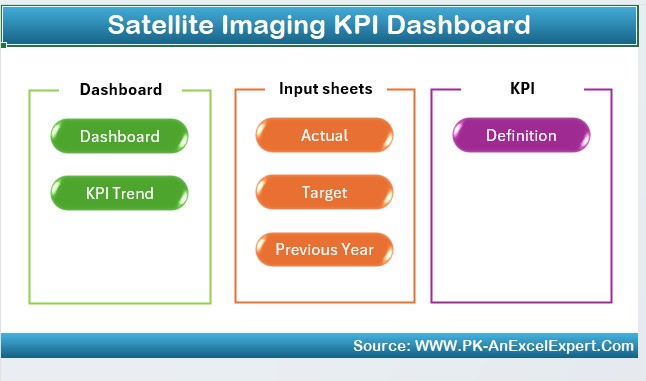
Worksheet Structure of the Dashboard
Let’s break down the structure of this Excel file so you can better understand how it works:
Home Sheet – Your Navigation Hub
- This is the landing page of the dashboard. Think of it as your control panel.
- It includes 6 navigation buttons to instantly jump to the related sheets.
- This enhances ease of use and saves time by eliminating endless scrolling or searching.
Dashboard Sheet – The Analytical Core
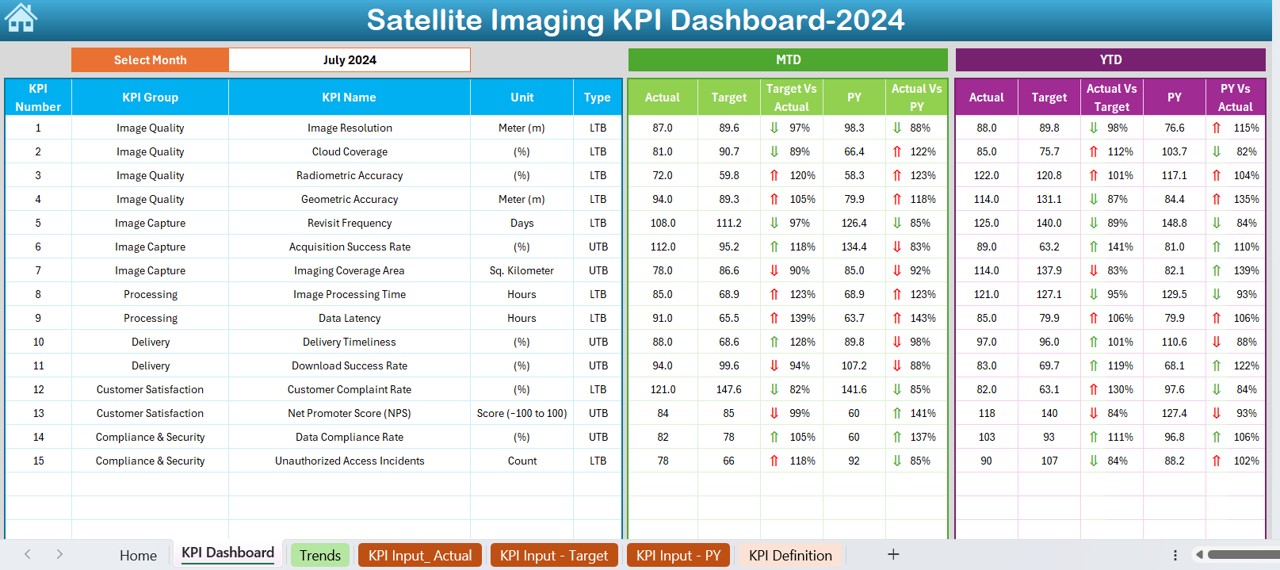
- The Dashboard sheet is where the real magic happens.
- Select any month using the drop-down in cell D3.
- The dashboard dynamically updates MTD (Month-to-Date) and YTD (Year-to-Date) data for that selected month.
- You’ll instantly see:
- Actual values
- Targets
- Previous Year numbers
- Variance Indicators (up/down arrows) using Conditional Formatting
This visual representation helps users quickly assess whether the KPIs are on track.
KPI Trend Sheet – Deep Dive into KPI Trends
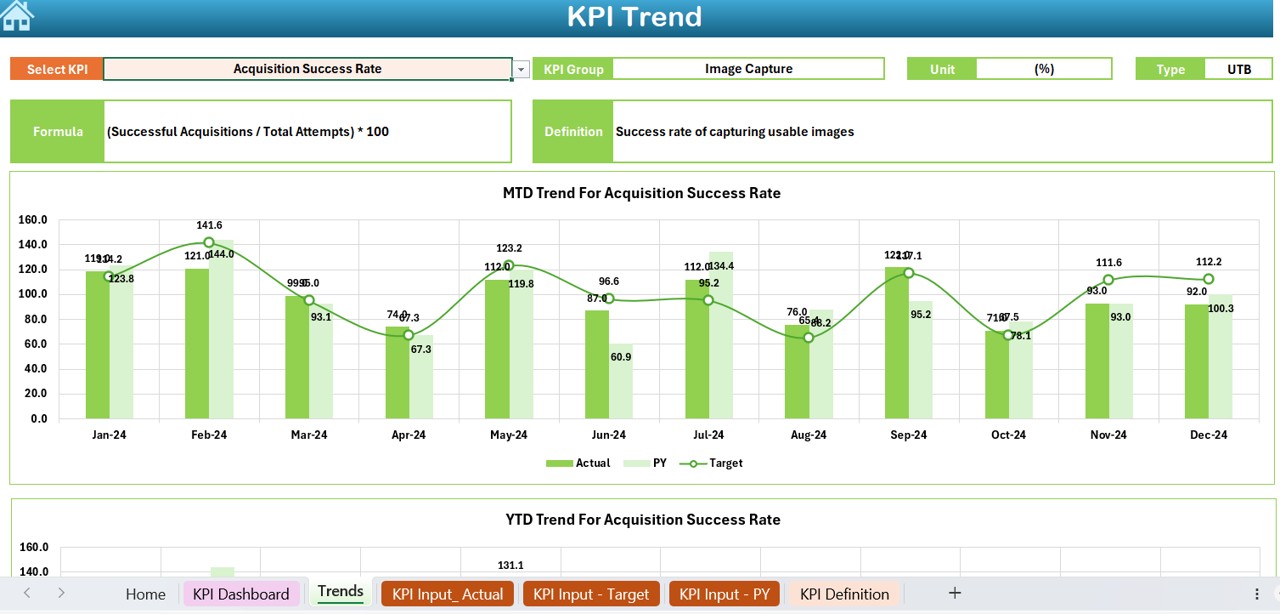
Want to explore how a KPI is trending over time? This is your go-to sheet!
Choose a KPI from the drop-down at cell C3.
You’ll see its:
- Group, Unit, Type (e.g., Lower is Better or Upper is Better)
- Formula and Definition
- Line charts for MTD and YTD trends comparing Actual vs Target vs Previous Year
- This makes it easier to identify patterns, spot outliers, and take action if something’s off.
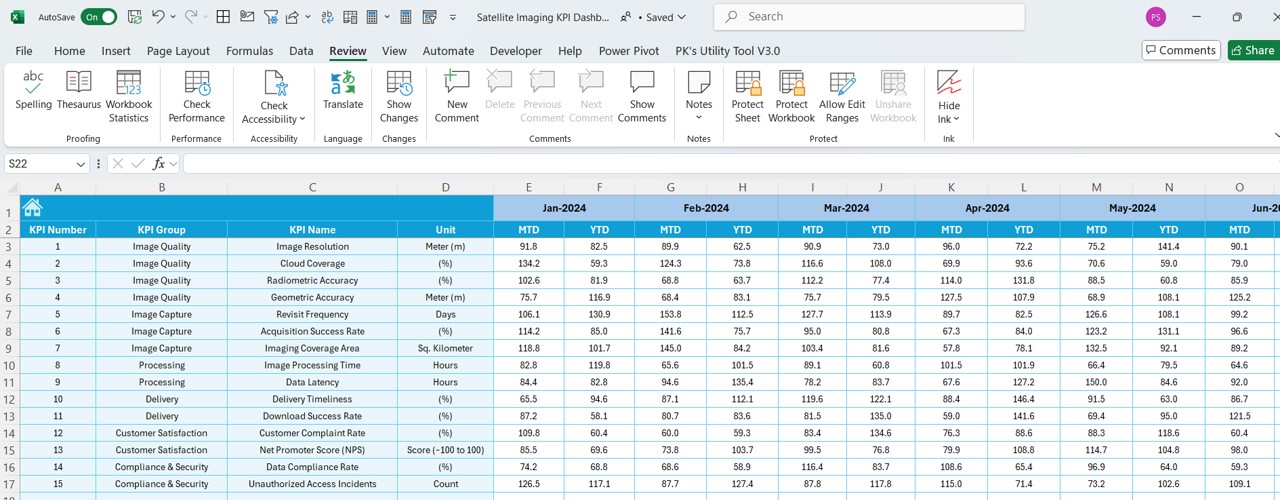
Actual Numbers Input Sheet – Your Data Entry Portal
- Accuracy begins with clean data entry.
- Select the start month using the drop-down in cell E1.
- Enter the MTD and YTD actual numbers for each KPI.
- This keeps your dashboard up-to-date and meaningful.
Click to Purchase Satellite Imaging KPI Dashboard in Excel
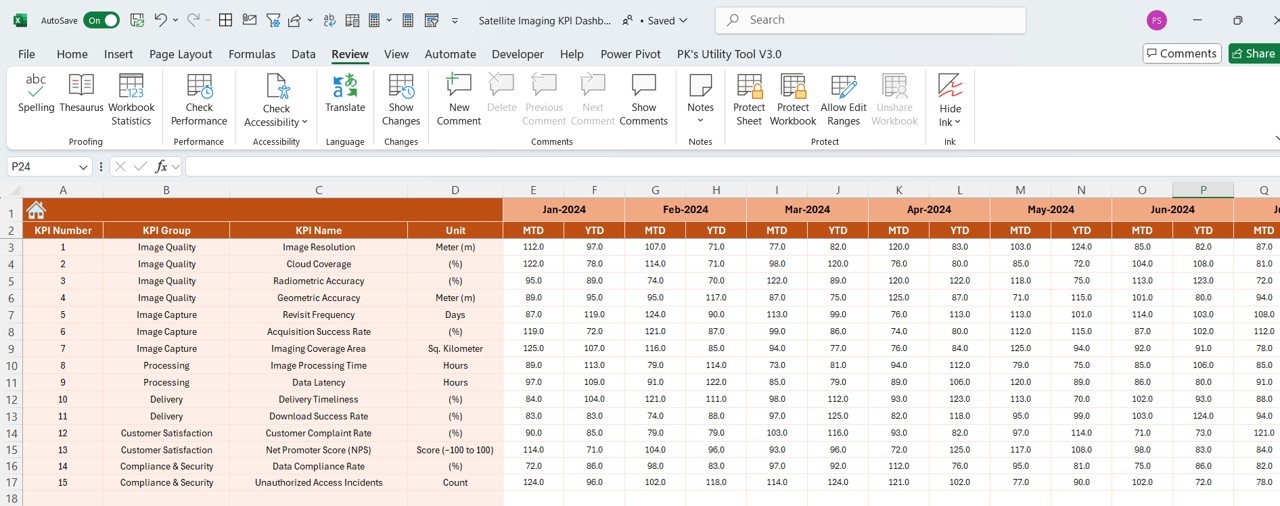
Target Sheet – Set Your Goals
- Every KPI needs a benchmark. In this sheet:
- Input monthly target numbers for MTD and YTD.
- This provides a solid base for comparison and performance tracking.
Previous Year Numbers Sheet – Compare to Past Performance
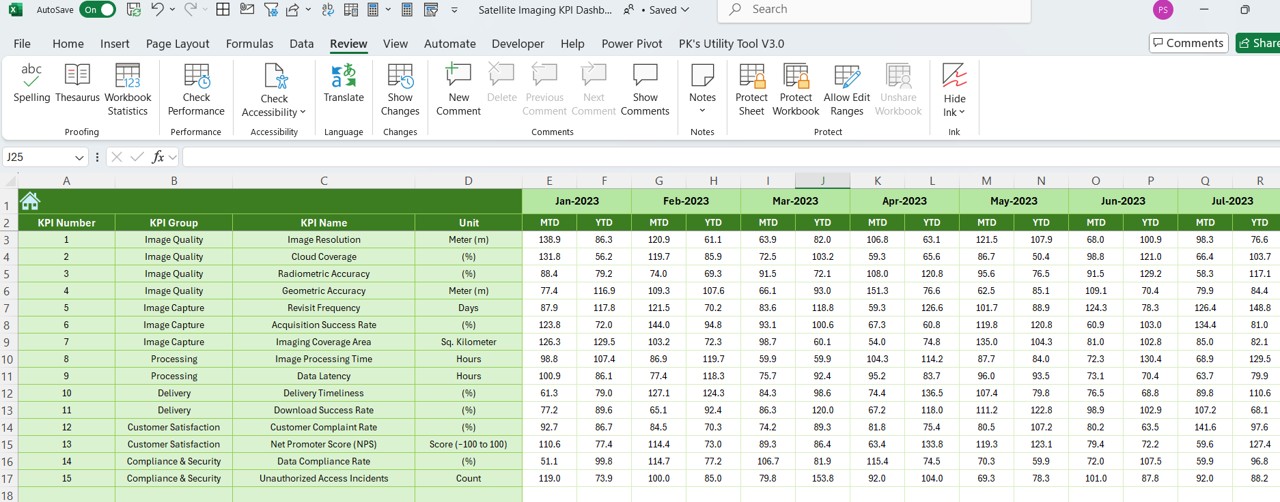
- Knowing where you stand is important, but knowing where you came from is even more powerful.
- Enter last year’s monthly numbers for each KPI.
- This enables YoY (Year-over-Year) comparison in the dashboard visuals.
KPI Definition Sheet – Define Everything Clearly
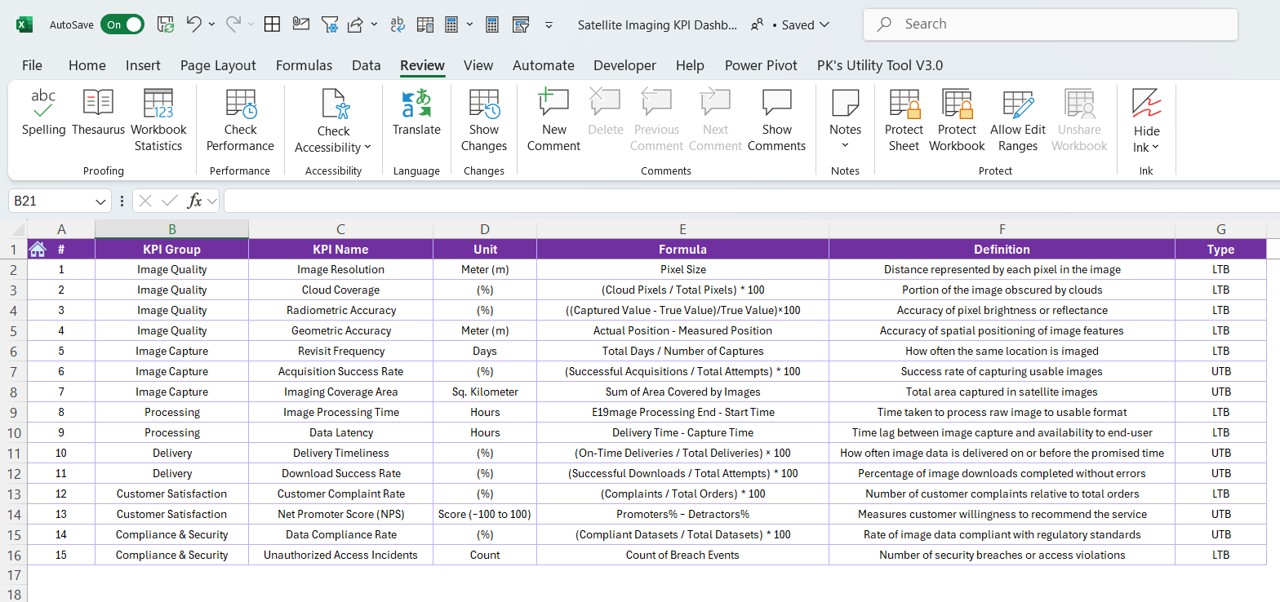
- Confused about what a KPI means? Not anymore.
- Define every KPI with its:
- Name
- Group
- Unit
- Formula
- Explanation
This sheet ensures clarity for all team members, regardless of their technical expertise.
Advantages of Using a Satellite Imaging KPI Dashboard in Excel
Let’s explore the powerful benefits of using this dashboard:
✅ Centralized KPI Monitoring: Instead of using multiple tools or spreadsheets, track everything in one clean, organized dashboard.
📉 Visual Representation of Data: From color-coded indicators to trend charts, this dashboard makes analysis visually intuitive.
🔁 Dynamic and Interactive: With drop-down filters and real-time updates, you can analyze MTD, YTD, and historical data without any manual calculations.
🧠 Easy to Use: You don’t need to be an Excel expert to use this template. Everything is laid out clearly and logically.
📆 Monthly and Yearly Analysis: Whether you want to assess short-term results or identify long-term patterns, this tool gives you both views.
🌍 Who Can Benefit from This Dashboard?: This Satellite Imaging KPI Dashboard is ideal for:
🛠️ Best Practices for the Satellite Imaging KPI Dashboard
To make the most of this tool, follow these best practices:
- Keep the Data Updated: Regularly enter the actual numbers, targets, and historical values to ensure your dashboard reflects the current performance.
- Define KPIs Clearly: Use the KPI Definition sheet effectively. Ensure every KPI has a well-written formula and description.
- Use Conditional Formatting Smartly: Avoid overloading the dashboard with too many colors. Stick to consistent visual cues for easy readability.
- Validate Your Inputs: Always double-check your numbers—especially in the Actual and Target sheets. A wrong input can skew the entire analysis.
- Train Your Team: Walk your team through the dashboard structure once. It only takes 10–15 minutes and saves confusion later.
🧪 How to Customize the Dashboard for Your Needs?
Although the template is ready-to-use, you can easily customize it for your organization:
🧮 Add new KPIs in the Definition and Input sheets
🌐 Change KPI categories based on your business focus
📊 Modify charts or visuals to suit branding needs
🔒 Protect sheets to avoid accidental changes
💡 Creative KPI Ideas for Satellite Imaging
🔚 Conclusion
The Satellite Imaging KPI Dashboard in Excel is a powerful, practical, and easy-to-use tool for any organization dealing with satellite data. By combining intuitive visuals with interactive controls, it helps teams stay focused, aligned, and informed about their performance—whether it’s monthly results or yearly trends.
Why struggle with disconnected spreadsheets and complicated tools when Excel can do it all? Try this dashboard today and take your satellite KPI monitoring to the next orbit! 🚀
❓ Frequently Asked Questions (FAQs)
What KPIs should I track for satellite imaging?
- Some common KPIs include:
- Image resolution accuracy
- Uptime hours
- Cloud-free image ratio
- Transmission speed
- Data processing time
Can I customize this dashboard for my team’s KPIs?
- Absolutely! You can:
- Add new KPIs
- Modify units or formulas
- Adjust visuals or colors
- Insert branding elements
Do I need Excel VBA to use this dashboard?
No VBA is required! The template runs on Excel formulas, conditional formatting, and drop-downs. It’s completely formula-based and lightweight.
Is this dashboard mobile-friendly?
It’s optimized for desktop/laptop use. However, it works smoothly on tablets using Excel apps. For mobile, navigation may be limited.
Click to Purchase Satellite Imaging KPI Dashboard in Excel
Visit our YouTube channel to learn step-by-step video tutorials