New: NextGenTemplates Academy - video courses on Excel formulas with AI and Pivot Tables & dashboards. Early-bird: 20% off with code EARLYBIRD20 - first 20 orders only. See the courses →
  • Learn Excel (Free Course)
    • 1. Shortcut Keys
    • 2. Fill & Flash Fill
    • 3. Find & Replace
    • 4. Sort & Filter
    • 5. Formulas & Functions
    • 6. Data Validation
    • 7. Conditional Formatting
    • 8. Basic Charts
    • 9. Advanced Charts
    • 10. Pivot Tables
    • 11. Excel Dashboards
    • 12. VBA Course
    • 13. Excel Formulas with AI
  • Templates
  • Tutorials
    • Charts and Visualization
    • VBA
    • Excel Tips and Tricks
    • Excel Dashboards
    • Power Pivot & DAX
  • Power BI
  • Template Store
    • Ready to Use Templates
  • Courses
  • Academy
    • Excel + AI Mastery: 100 Formulas
    • Excel Pivot Tables & Dashboards
  • About Us
  • Contact Us

PK: An Excel Expert

Transforming Data into Decisions

Tag: Advocacy Performance Tracking

Power BI Templates

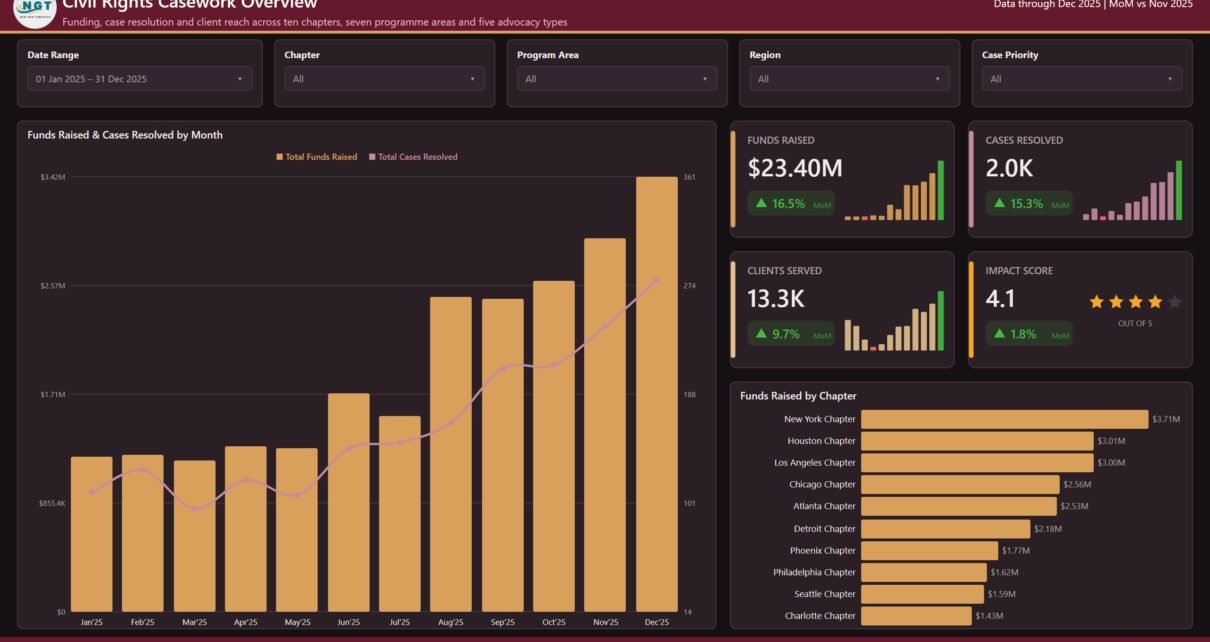
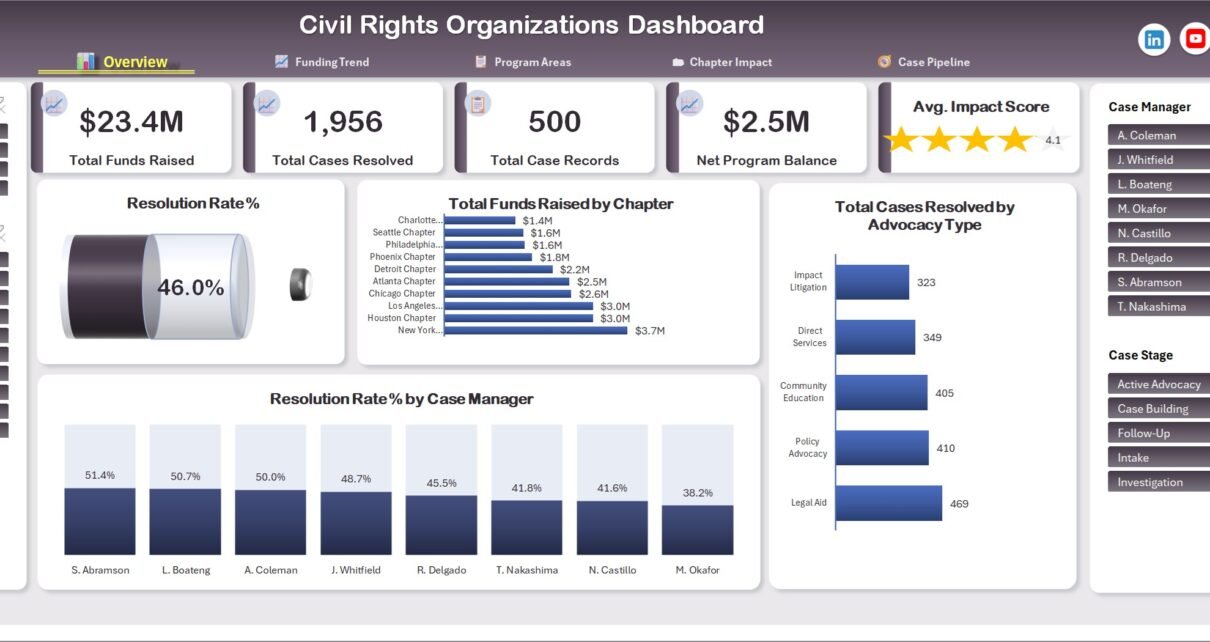
Civil Rights Organizations Dashboard in Power BI

August 19, 2026August 19, 2026 PKComments Off on Civil Rights Organizations Dashboard in Power BI
The Civil Rights Organizations Dashboard in Power BI is an administrative reporting layer built over an advocacy or non-profit organisation's own operational records. The file contains 9 report pages —
Read More
Dashboard Templates

Civil Rights Organizations Dashboard in Excel

August 18, 2026August 18, 2026 PKComments Off on Civil Rights Organizations Dashboard in Excel
Most advocacy and non-profit teams already have the numbers. They sit in a spreadsheet somebody maintains, in a case log, in a funding tracker, in a chapter's monthly return. What
Read More
Dashboard Power BI

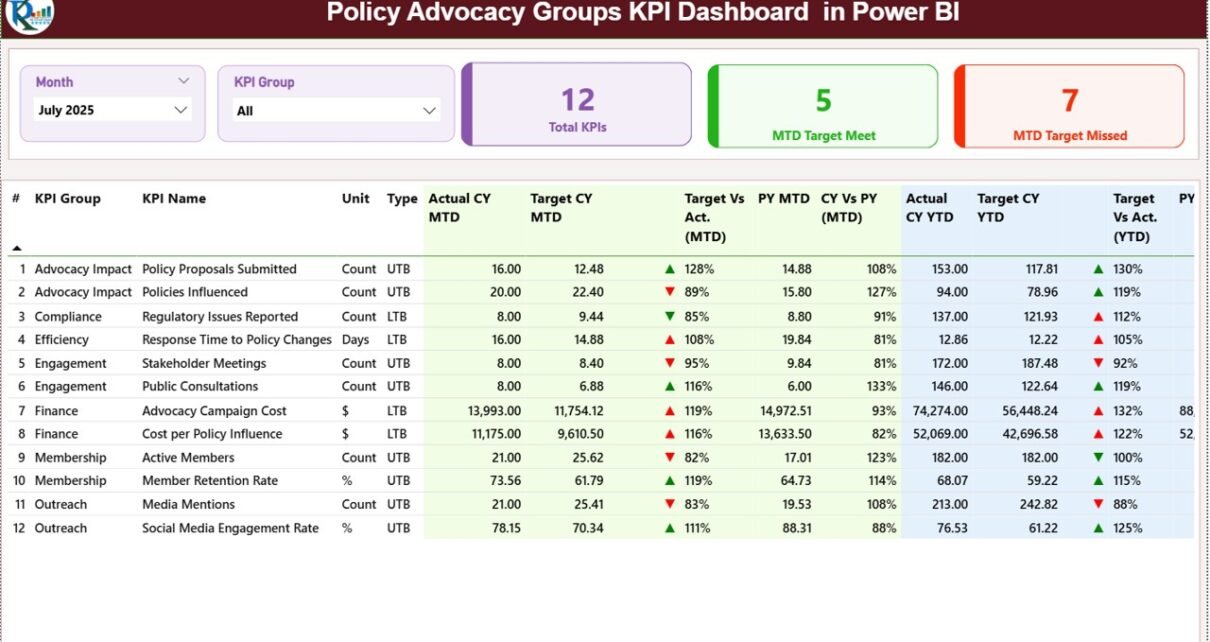
Policy Advocacy Groups KPI Dashboard in Power BI

February 11, 2026February 11, 2026 PKComments Off on Policy Advocacy Groups KPI Dashboard in Power BI
Policy advocacy groups work to create change. They run campaigns, influence decision-makers, mobilize communities, and track outcomes. However, many organizations still rely on manual Excel summaries or scattered reports. As
Read More
  • Learn Excel (Free Course)
    • 1. Shortcut Keys
    • 2. Fill & Flash Fill
    • 3. Find & Replace
    • 4. Sort & Filter
    • 5. Formulas & Functions
    • 6. Data Validation
    • 7. Conditional Formatting
    • 8. Basic Charts
    • 9. Advanced Charts
    • 10. Pivot Tables
    • 11. Excel Dashboards
    • 12. VBA Course
    • 13. Excel Formulas with AI
  • Templates
  • Tutorials
    • Charts and Visualization
    • VBA
    • Excel Tips and Tricks
    • Excel Dashboards
    • Power Pivot & DAX
  • Power BI
  • Template Store
    • Ready to Use Templates
  • Courses
  • Academy
    • Excel + AI Mastery: 100 Formulas
    • Excel Pivot Tables & Dashboards
  • About Us
  • Contact Us
Copyright © 2023 PK-AnExcelExpert.com - Privacy Policy