New: NextGenTemplates Academy - video courses on Excel formulas with AI and Pivot Tables & dashboards. Early-bird: 20% off with code EARLYBIRD20 - first 20 orders only. See the courses →
  • Learn Excel (Free Course)
    • 1. Shortcut Keys
    • 2. Fill & Flash Fill
    • 3. Find & Replace
    • 4. Sort & Filter
    • 5. Formulas & Functions
    • 6. Data Validation
    • 7. Conditional Formatting
    • 8. Basic Charts
    • 9. Advanced Charts
    • 10. Pivot Tables
    • 11. Excel Dashboards
    • 12. VBA Course
    • 13. Excel Formulas with AI
  • Templates
  • Tutorials
    • Charts and Visualization
    • VBA
    • Excel Tips and Tricks
    • Excel Dashboards
    • Power Pivot & DAX
  • Power BI
  • Template Store
    • Ready to Use Templates
  • Courses
  • Academy
    • Excel + AI Mastery: 100 Formulas
    • Excel Pivot Tables & Dashboards
  • About Us
  • Contact Us

PK: An Excel Expert

Transforming Data into Decisions

Tag: Agent Performance

Dashboard Power BI

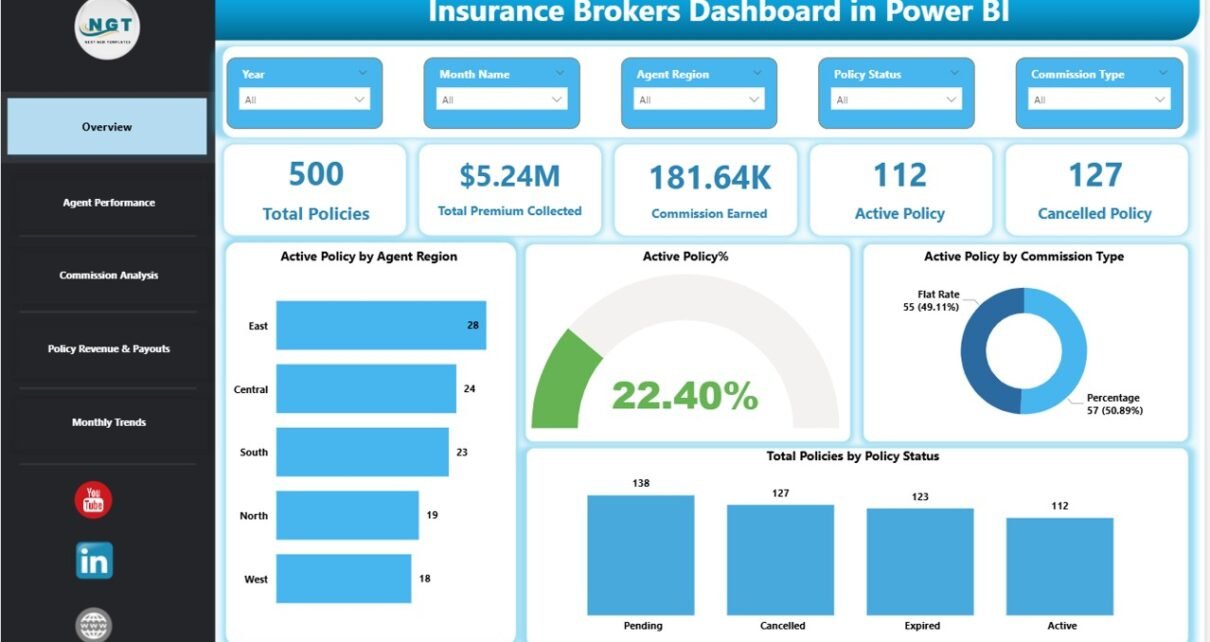
Insurance Brokers Dashboard in Power BI

February 12, 2026February 12, 2026 PKComments Off on Insurance Brokers Dashboard in Power BI
The insurance industry moves fast. Brokers handle hundreds of policies. Agents chase targets. Commissions change every month. Moreover, leaders need real-time numbers to make smart decisions.However, many brokerage firms still
Read More
Dashboard

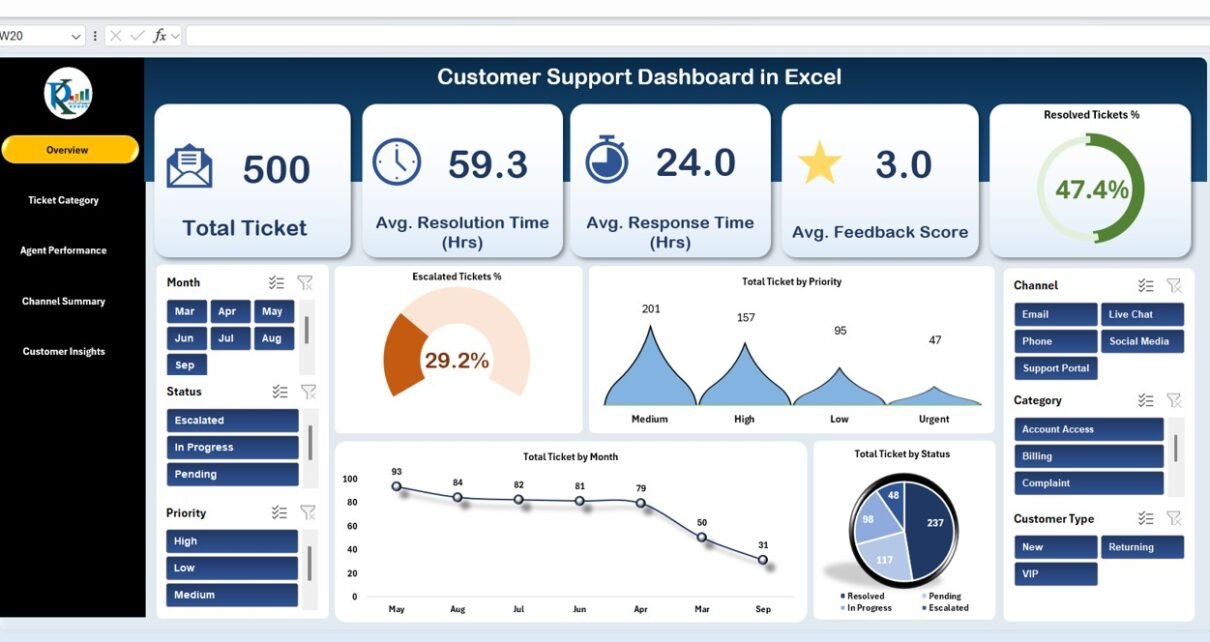
Customer Support Dashboard in Excel

September 23, 2025September 23, 2025 PKComments Off on Customer Support Dashboard in Excel
Efficient customer support is critical for maintaining satisfaction, loyalty, and business growth. The Customer Support Dashboard in Excel is a ready-to-use solution that allows support teams and managers to monitor
Read More
Dashboard

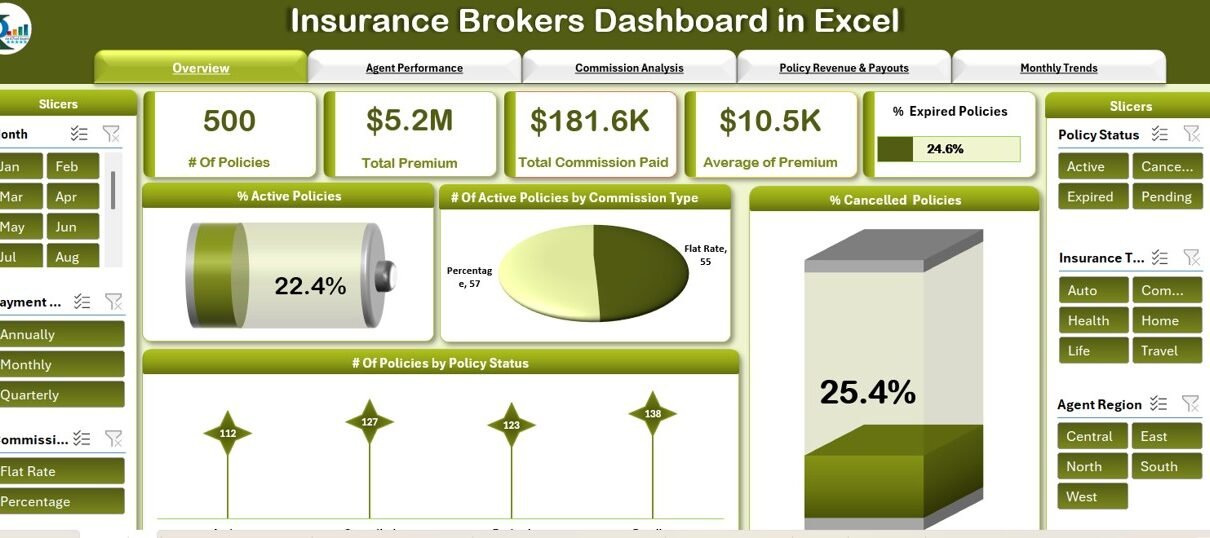
Insurance Brokers Dashboard in Excel

June 25, 2025June 29, 2025 PKComments Off on Insurance Brokers Dashboard in Excel
In the competitive world of insurance, it’s crucial for brokers to have clear visibility into their operations, track commissions, manage policies, and assess agent performance. The Insurance Brokers Dashboard in
Read More
Power BI

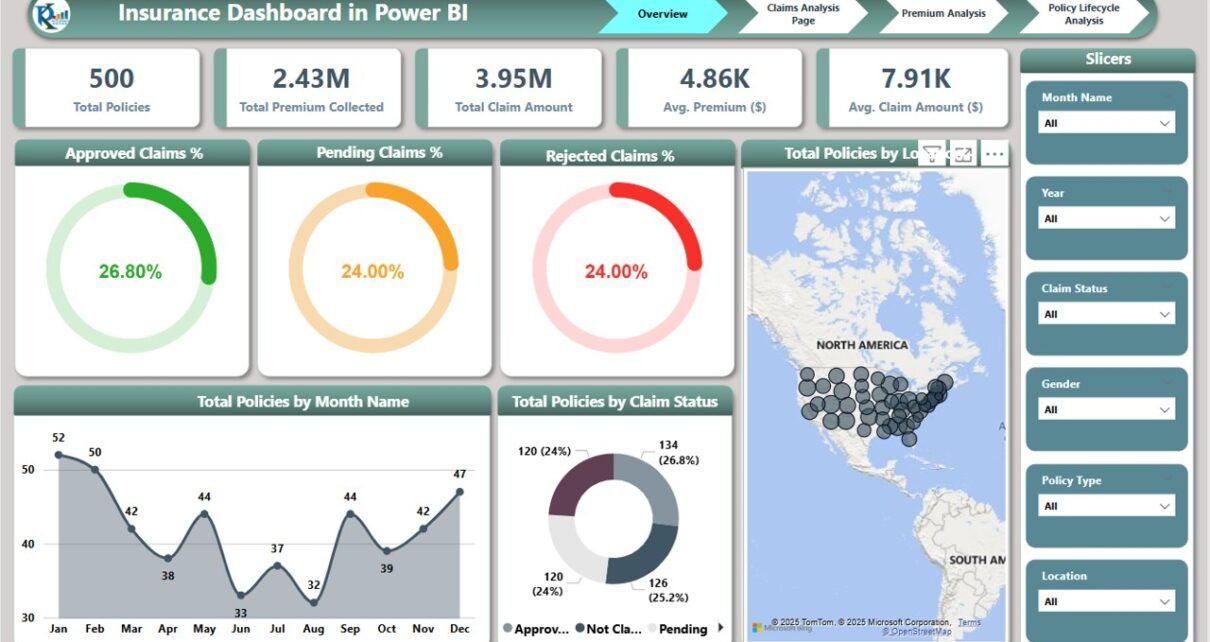
Insurance Dashboard in Power BI

June 24, 2025June 24, 2025 PKComments Off on Insurance Dashboard in Power BI
In the fast-paced world of insurance, being able to visualize and manage key metrics is essential for making informed business decisions. The Insurance Dashboard in Power BI is a ready-to-use
Read More
Power BI

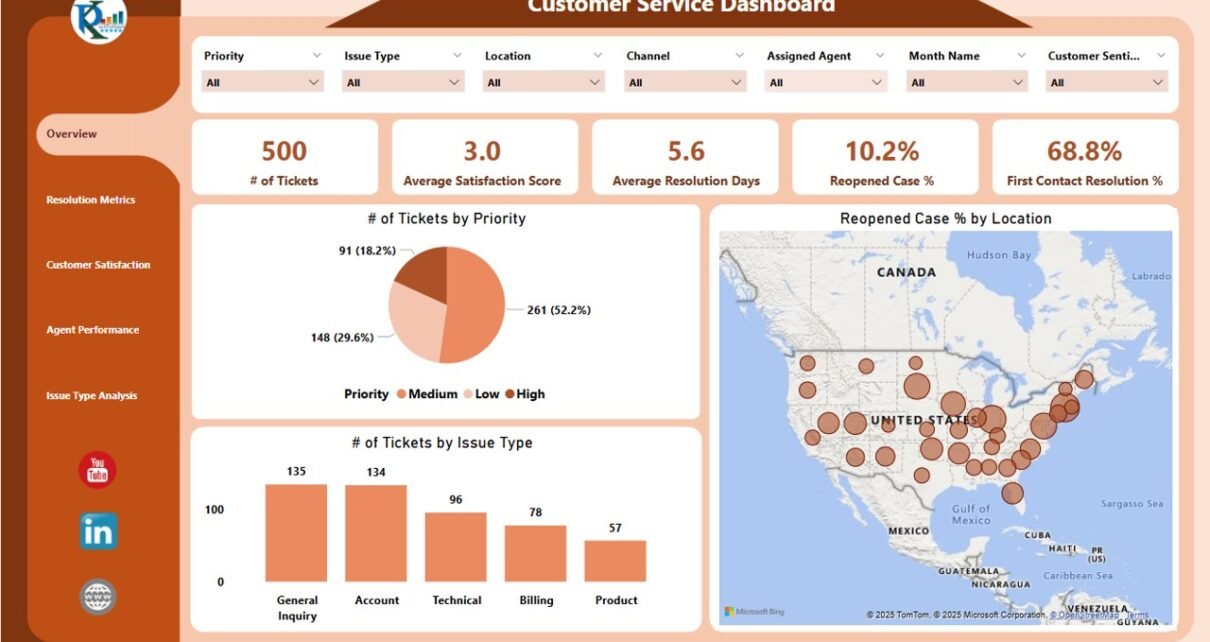
Customer Service Dashboard in Power BI

June 1, 2025June 8, 2025 PKComments Off on Customer Service Dashboard in Power BI
Effective customer service is crucial for ensuring customer satisfaction, loyalty, and business growth. The Customer Service Dashboard in Power BI is a powerful tool designed to help organizations monitor key
Read More
Charts and Visualization Dashboard

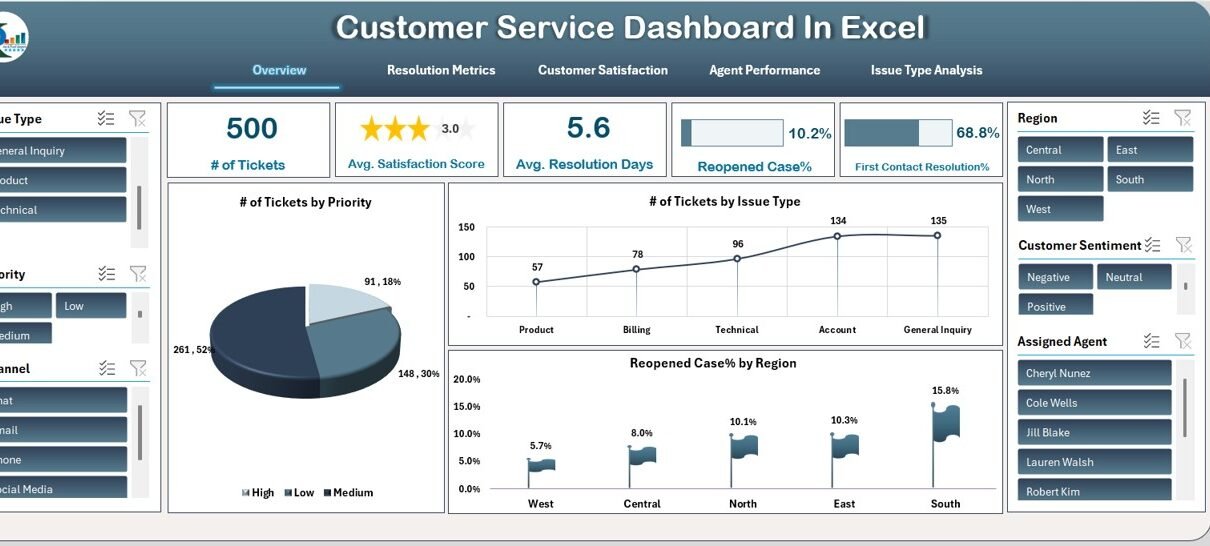
Customer Service Dashboard in Excel

April 22, 2025April 23, 2025 PKComments Off on Customer Service Dashboard in Excel
Creating a Customer Service Dashboard in Excel is an excellent way to track, manage, and improve the efficiency of your customer service team. A well-organized dashboard enables businesses to gain
Read More
  • Learn Excel (Free Course)
    • 1. Shortcut Keys
    • 2. Fill & Flash Fill
    • 3. Find & Replace
    • 4. Sort & Filter
    • 5. Formulas & Functions
    • 6. Data Validation
    • 7. Conditional Formatting
    • 8. Basic Charts
    • 9. Advanced Charts
    • 10. Pivot Tables
    • 11. Excel Dashboards
    • 12. VBA Course
    • 13. Excel Formulas with AI
  • Templates
  • Tutorials
    • Charts and Visualization
    • VBA
    • Excel Tips and Tricks
    • Excel Dashboards
    • Power Pivot & DAX
  • Power BI
  • Template Store
    • Ready to Use Templates
  • Courses
  • Academy
    • Excel + AI Mastery: 100 Formulas
    • Excel Pivot Tables & Dashboards
  • About Us
  • Contact Us
Copyright © 2023 PK-AnExcelExpert.com - Privacy Policy