New: NextGenTemplates Academy - video courses on Excel formulas with AI and Pivot Tables & dashboards. Early-bird: 20% off with code EARLYBIRD20 - first 20 orders only. See the courses →
  • Learn Excel (Free Course)
    • 1. Shortcut Keys
    • 2. Fill & Flash Fill
    • 3. Find & Replace
    • 4. Sort & Filter
    • 5. Formulas & Functions
    • 6. Data Validation
    • 7. Conditional Formatting
    • 8. Basic Charts
    • 9. Advanced Charts
    • 10. Pivot Tables
    • 11. Excel Dashboards
    • 12. VBA Course
    • 13. Excel Formulas with AI
  • Templates
  • Tutorials
    • Charts and Visualization
    • VBA
    • Excel Tips and Tricks
    • Excel Dashboards
    • Power Pivot & DAX
  • Power BI
  • Template Store
    • Ready to Use Templates
  • Courses
  • Academy
    • Excel + AI Mastery: 100 Formulas
    • Excel Pivot Tables & Dashboards
  • About Us
  • Contact Us

PK: An Excel Expert

Transforming Data into Decisions

Tag: Agricultural Analytics

Dashboard

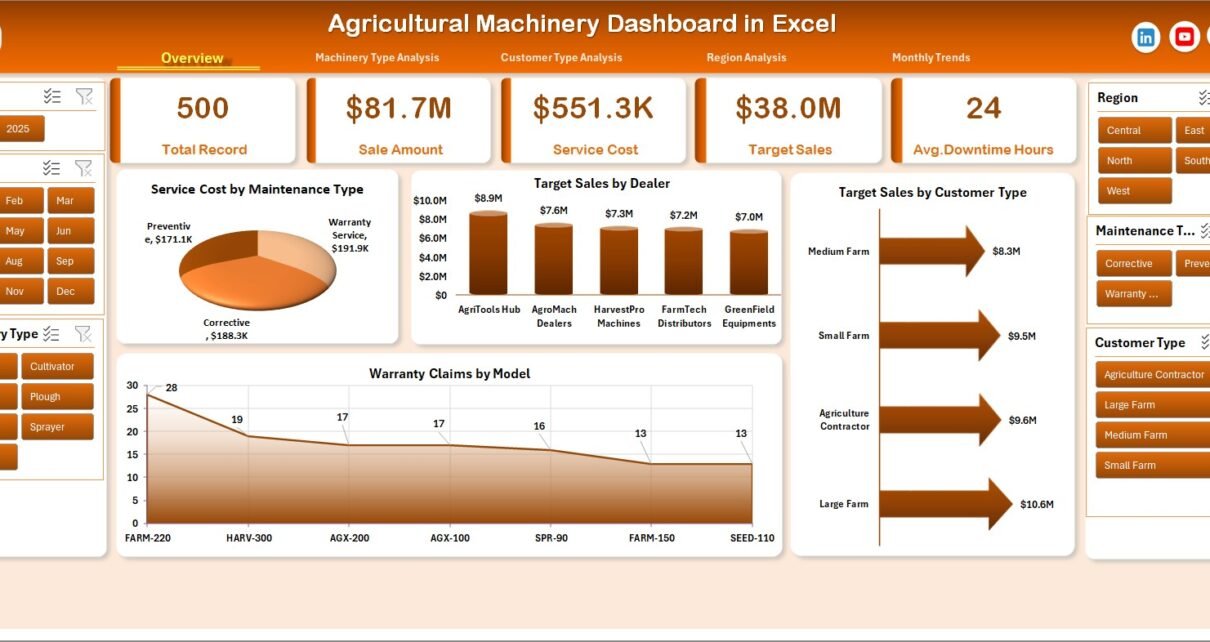
Agricultural Machinery Dashboard in Excel

March 9, 2026March 9, 2026 PKComments Off on Agricultural Machinery Dashboard in Excel
Agricultural machinery plays a vital role in modern farming. Farmers, agricultural equipment dealers, service centers, and agribusiness companies rely heavily on tractors, harvesters, seeders, irrigation machines, and other farming equipment
Read More
Dashboard

Greenhouse Farming KPI Dashboard in Excel

January 10, 2026January 10, 2026 PKComments Off on Greenhouse Farming KPI Dashboard in Excel
Greenhouse farming has transformed modern agriculture by enabling year-round production, controlled growing conditions, and higher crop yields. However, as greenhouse operations grow in size and complexity, managing performance without proper
Read More
Dashboard

Crop Advisory Platforms Dashboard in Excel

January 6, 2026January 6, 2026 PKComments Off on Crop Advisory Platforms Dashboard in Excel
Modern agriculture increasingly depends on data, insights, and timely advisory services. Farmers, agritech companies, cooperatives, and advisory platforms must continuously evaluate costs, yields, risks, and profitability. However, without a structured
Read More
Dashboard

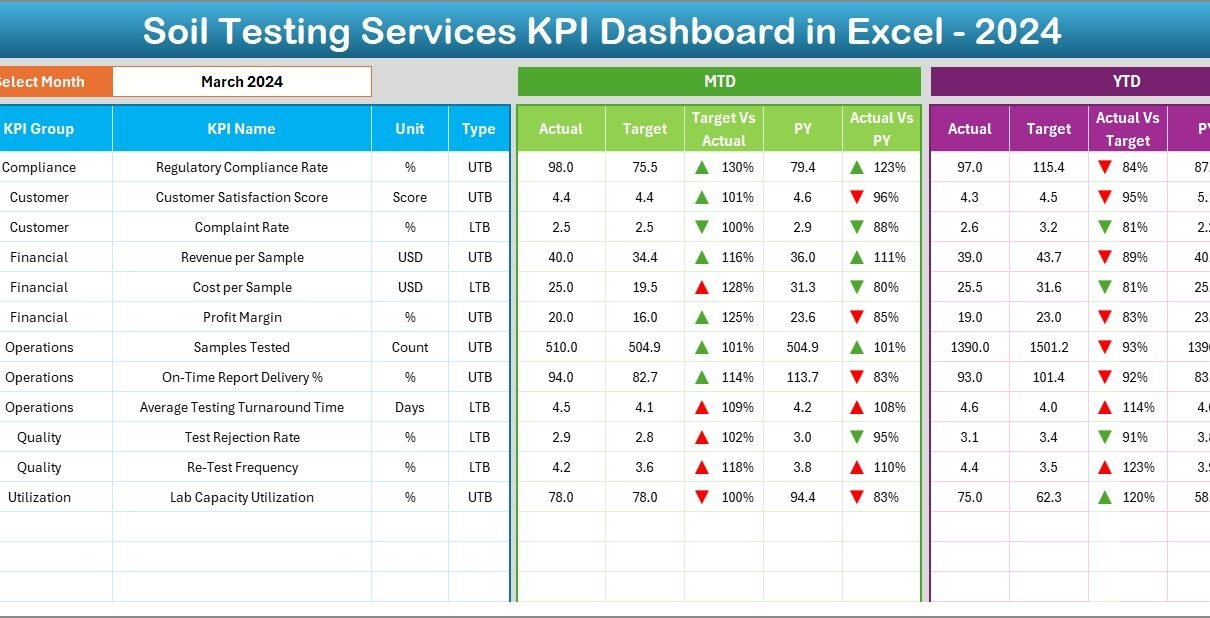
Soil Testing Services KPI Dashboard in Excel

January 2, 2026October 10, 2026 PKComments Off on Soil Testing Services KPI Dashboard in Excel
In today’s data-driven agriculture and environmental services industry, soil testing service providers must track performance with precision. Accuracy, turnaround time, client satisfaction, and operational efficiency directly impact credibility and revenue.
Read More
  • Learn Excel (Free Course)
    • 1. Shortcut Keys
    • 2. Fill & Flash Fill
    • 3. Find & Replace
    • 4. Sort & Filter
    • 5. Formulas & Functions
    • 6. Data Validation
    • 7. Conditional Formatting
    • 8. Basic Charts
    • 9. Advanced Charts
    • 10. Pivot Tables
    • 11. Excel Dashboards
    • 12. VBA Course
    • 13. Excel Formulas with AI
  • Templates
  • Tutorials
    • Charts and Visualization
    • VBA
    • Excel Tips and Tricks
    • Excel Dashboards
    • Power Pivot & DAX
  • Power BI
  • Template Store
    • Ready to Use Templates
  • Courses
  • Academy
    • Excel + AI Mastery: 100 Formulas
    • Excel Pivot Tables & Dashboards
  • About Us
  • Contact Us
Copyright © 2023 PK-AnExcelExpert.com - Privacy Policy