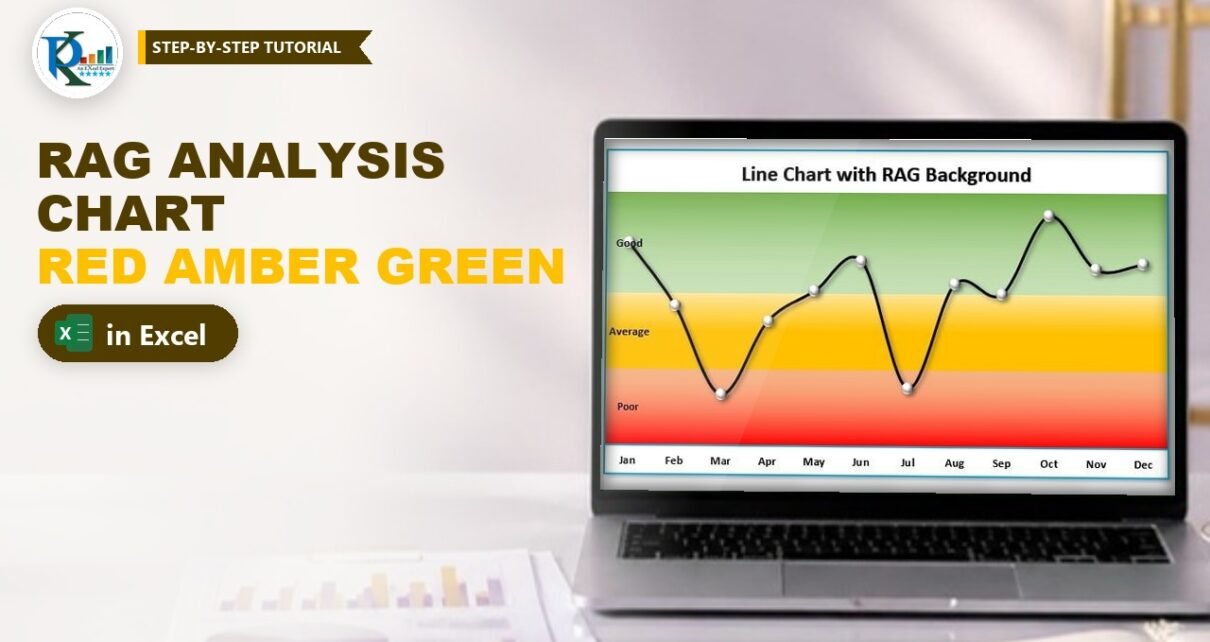
Charts and VisualizationRAG (Red, Amber and Green) Analysis Chart in Excel May 20, 2019October 9, 2026 PKComments Off on RAG (Red, Amber and Green) Analysis Chart in Excel A RAG analysis chart in Excel draws your monthly results as a line on top of red, amber and green bands, so you can see at a glance which months Read More