New: NextGenTemplates Academy - video courses on Excel formulas with AI and Pivot Tables & dashboards. Early-bird: 20% off with code EARLYBIRD20 - first 20 orders only. See the courses →
  • Learn Excel (Free Course)
    • 1. Shortcut Keys
    • 2. Fill & Flash Fill
    • 3. Find & Replace
    • 4. Sort & Filter
    • 5. Formulas & Functions
    • 6. Data Validation
    • 7. Conditional Formatting
    • 8. Basic Charts
    • 9. Advanced Charts
    • 10. Pivot Tables
    • 11. Excel Dashboards
    • 12. VBA Course
    • 13. Excel Formulas with AI
  • Templates
  • Tutorials
    • Charts and Visualization
    • VBA
    • Excel Tips and Tricks
    • Excel Dashboards
    • Power Pivot & DAX
  • Power BI
  • Template Store
    • Ready to Use Templates
  • Courses
  • Academy
    • Excel + AI Mastery: 100 Formulas
    • Excel Pivot Tables & Dashboards
  • About Us
  • Contact Us

PK: An Excel Expert

Transforming Data into Decisions

Tag: brand analysis dashboard

Power BI

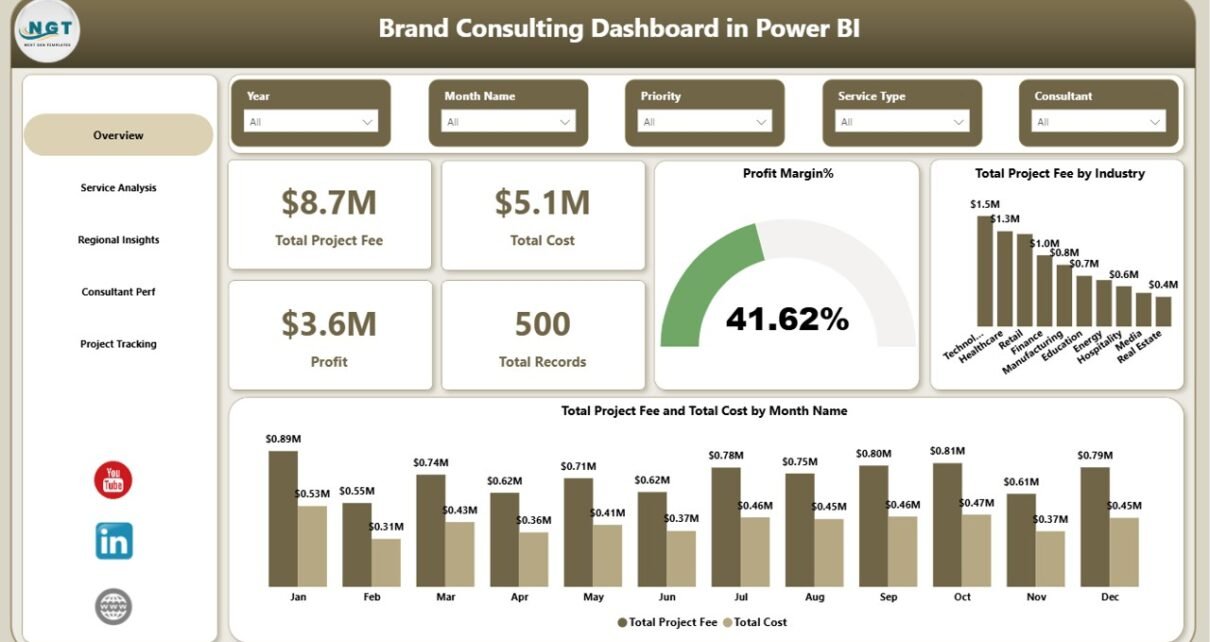
Brand Consulting Dashboard in Power BI

April 3, 2026April 3, 2026 PKComments Off on Brand Consulting Dashboard in Power BI
Brand Consulting Dashboard in Power BI is a powerful, ready-to-use Power BI dashboard template designed for brand consultants, marketing agency owners, strategy professionals, and consulting firms who need instant visibility
Read More
Dashboard Power BI

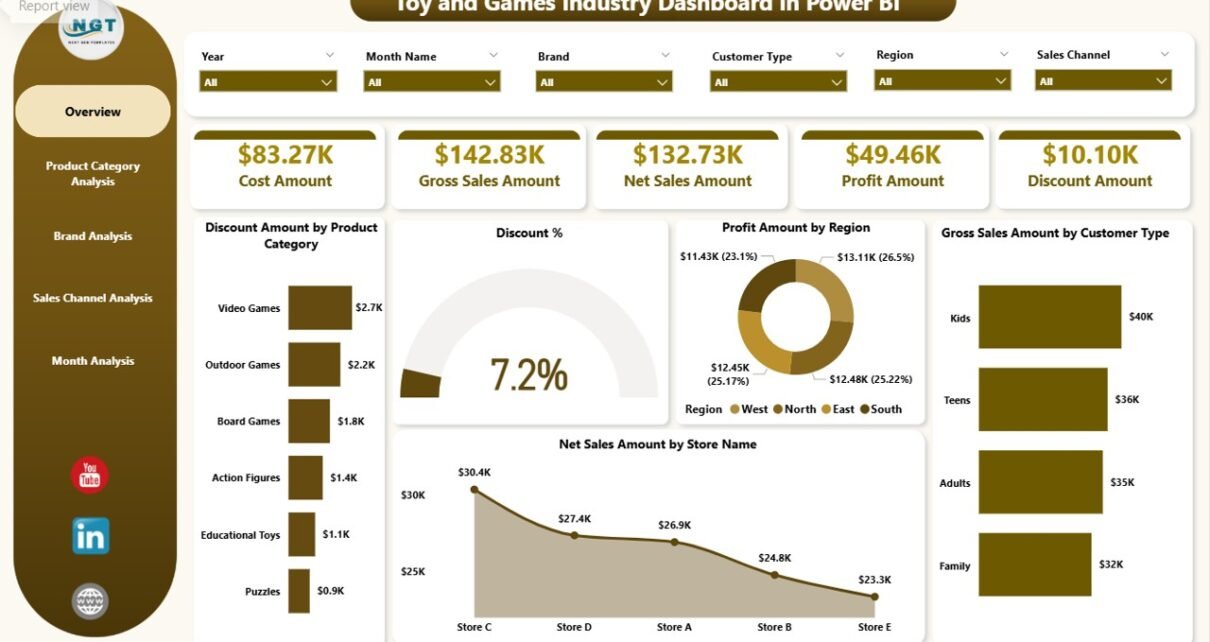
Toy and Games Industry Dashboard in Power BI

January 29, 2026January 29, 2026 PKComments Off on Toy and Games Industry Dashboard in Power BI
The toy and games industry thrives on creativity, trends, and seasonal demand. However, without clear data visibility, even the most innovative toy businesses struggle to grow. That is exactly where
Read More
Dashboard

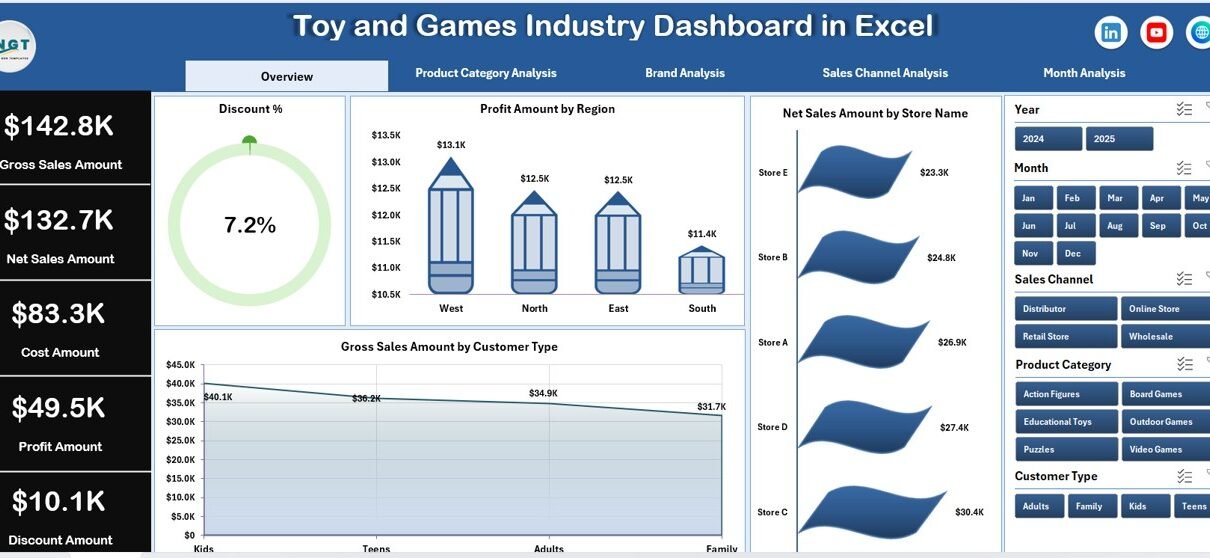
Toy and Games Industry Dashboard in Excel

January 29, 2026January 29, 2026 PKComments Off on Toy and Games Industry Dashboard in Excel
The toy and games industry moves fast. Customer preferences change quickly, seasonal demand impacts sales heavily, and margins depend on smart pricing and discount strategies. Because of this, businesses in
Read More
Dashboard

Optical Retail Dashboard in Excel

November 16, 2025November 16, 2025 PKComments Off on Optical Retail Dashboard in Excel
Running an optical retail business requires accurate data, quick decisions, and clear insights. However, many optical stores still try to track sales, customer behavior, and brand performance by using scattered
Read More
  • Learn Excel (Free Course)
    • 1. Shortcut Keys
    • 2. Fill & Flash Fill
    • 3. Find & Replace
    • 4. Sort & Filter
    • 5. Formulas & Functions
    • 6. Data Validation
    • 7. Conditional Formatting
    • 8. Basic Charts
    • 9. Advanced Charts
    • 10. Pivot Tables
    • 11. Excel Dashboards
    • 12. VBA Course
    • 13. Excel Formulas with AI
  • Templates
  • Tutorials
    • Charts and Visualization
    • VBA
    • Excel Tips and Tricks
    • Excel Dashboards
    • Power Pivot & DAX
  • Power BI
  • Template Store
    • Ready to Use Templates
  • Courses
  • Academy
    • Excel + AI Mastery: 100 Formulas
    • Excel Pivot Tables & Dashboards
  • About Us
  • Contact Us
Copyright © 2023 PK-AnExcelExpert.com - Privacy Policy