New: NextGenTemplates Academy - video courses on Excel formulas with AI and Pivot Tables & dashboards. Early-bird: 20% off with code EARLYBIRD20 - first 20 orders only. See the courses →
  • Learn Excel (Free Course)
    • 1. Shortcut Keys
    • 2. Fill & Flash Fill
    • 3. Find & Replace
    • 4. Sort & Filter
    • 5. Formulas & Functions
    • 6. Data Validation
    • 7. Conditional Formatting
    • 8. Basic Charts
    • 9. Advanced Charts
    • 10. Pivot Tables
    • 11. Excel Dashboards
    • 12. VBA Course
    • 13. Excel Formulas with AI
  • Templates
  • Tutorials
    • Charts and Visualization
    • VBA
    • Excel Tips and Tricks
    • Excel Dashboards
    • Power Pivot & DAX
  • Power BI
  • Template Store
    • Ready to Use Templates
  • Courses
  • Academy
    • Excel + AI Mastery: 100 Formulas
    • Excel Pivot Tables & Dashboards
  • About Us
  • Contact Us

PK: An Excel Expert

Transforming Data into Decisions

Tag: Budget Tracking Dashboard

Dashboard

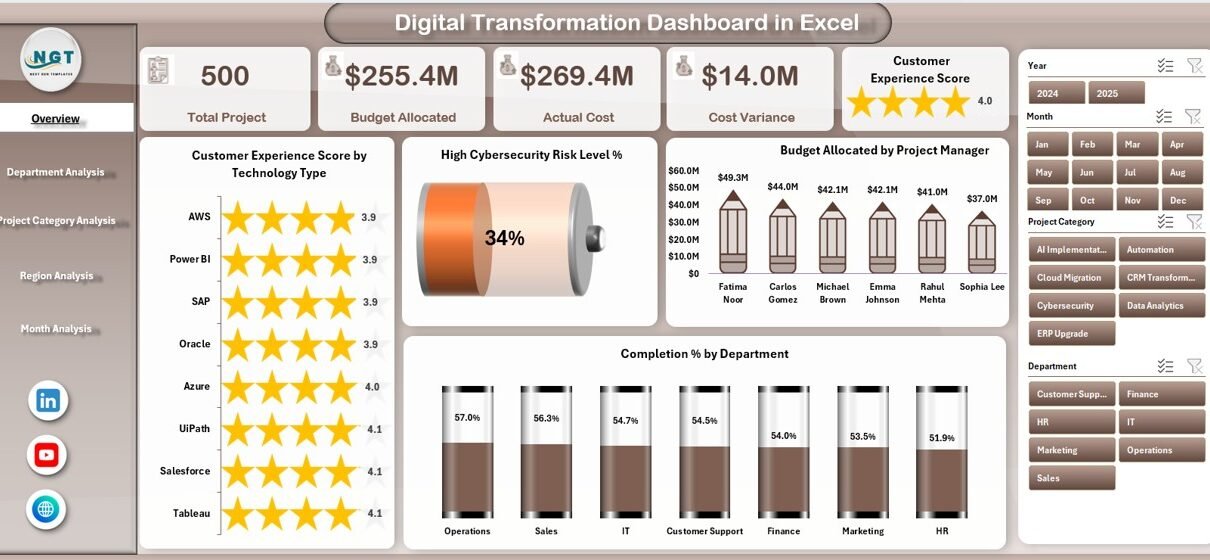
Digital Transformation Dashboard in Excel

February 11, 2026February 11, 2026 PKComments Off on Digital Transformation Dashboard in Excel
This ready-to-use dashboard gives leaders complete visibility into transformation projects. Moreover, it converts raw data into clear, interactive insights. As a result, decision-makers can track performance, control budgets, and improve
Read More
Dashboard Power BI

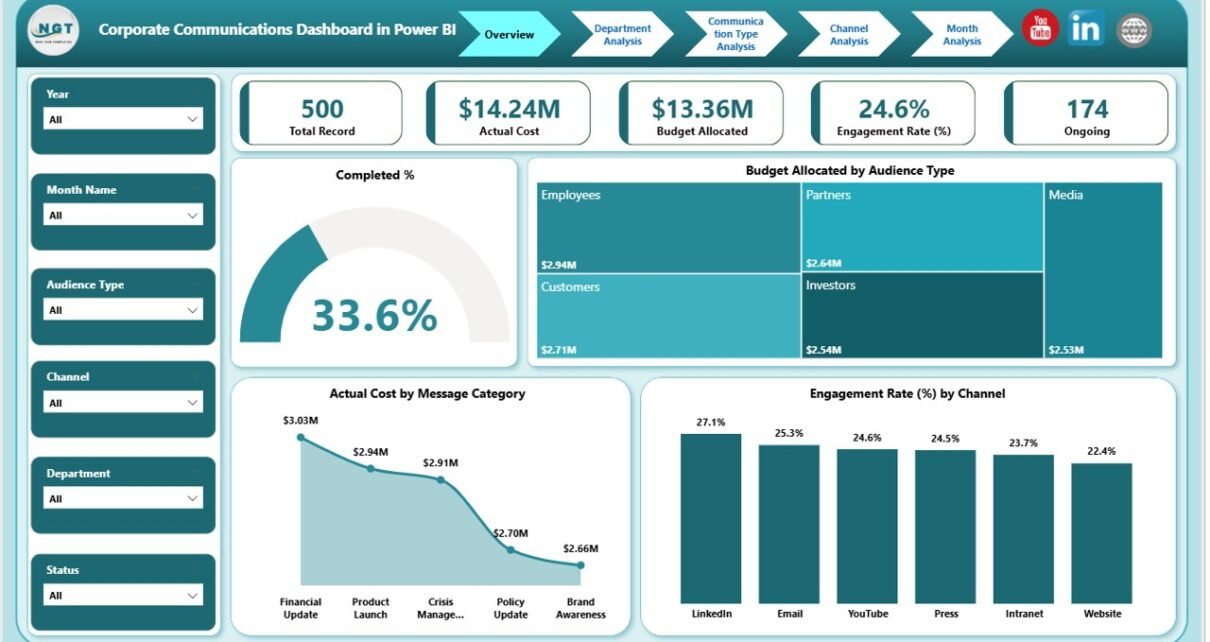
Corporate Communications Dashboard in Power BI

February 10, 2026February 10, 2026 PKComments Off on Corporate Communications Dashboard in Power BI
In today’s fast-moving business environment, companies must manage internal and external communication with clarity and control. However, many teams still rely on scattered Excel sheets and manual reports. As a
Read More
Dashboard Power BI

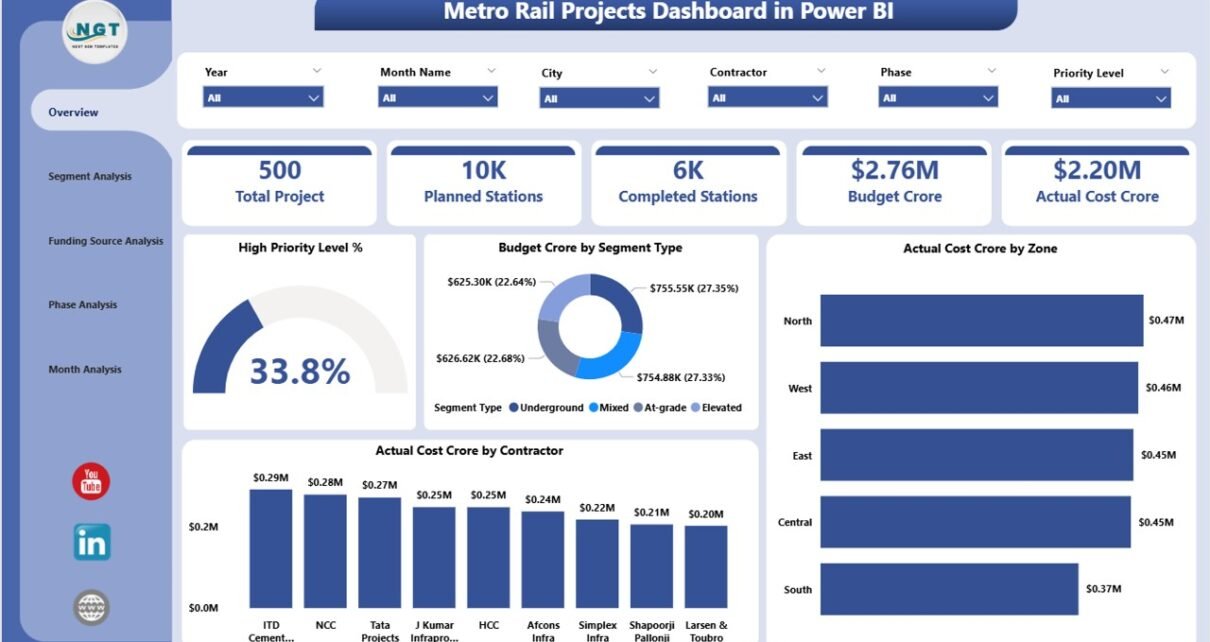
Metro Rail Projects Dashboard in Power BI

December 15, 2025December 15, 2025 PKComments Off on Metro Rail Projects Dashboard in Power BI
Urban transportation systems continue to expand rapidly. As cities grow, metro rail projects play a crucial role in reducing congestion, lowering pollution, and improving mobility. However, metro rail projects involve
Read More
Dashboard Power BI

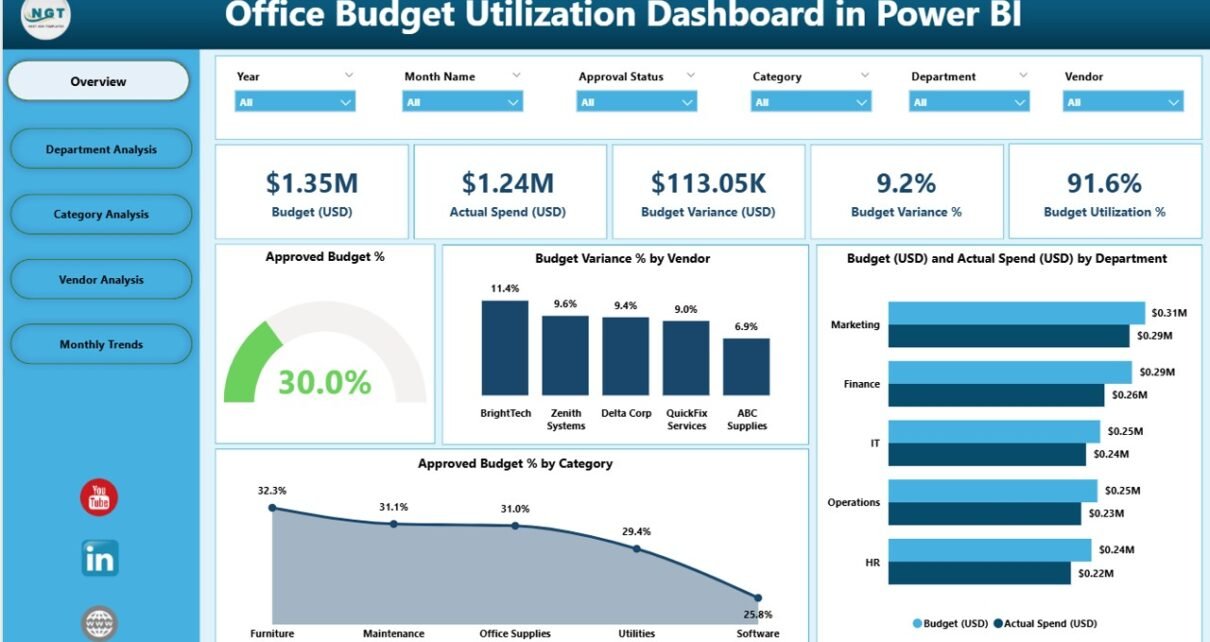
Office Budget Utilization Dashboard in Power BI

October 1, 2025October 1, 2025 PKComments Off on Office Budget Utilization Dashboard in Power BI
An Office Budget Utilization Dashboard in Power BI is a pre-built, interactive reporting solution that integrates financial data from Excel or other data sources. It allows organizations to track approved
Read More
  • Learn Excel (Free Course)
    • 1. Shortcut Keys
    • 2. Fill & Flash Fill
    • 3. Find & Replace
    • 4. Sort & Filter
    • 5. Formulas & Functions
    • 6. Data Validation
    • 7. Conditional Formatting
    • 8. Basic Charts
    • 9. Advanced Charts
    • 10. Pivot Tables
    • 11. Excel Dashboards
    • 12. VBA Course
    • 13. Excel Formulas with AI
  • Templates
  • Tutorials
    • Charts and Visualization
    • VBA
    • Excel Tips and Tricks
    • Excel Dashboards
    • Power Pivot & DAX
  • Power BI
  • Template Store
    • Ready to Use Templates
  • Courses
  • Academy
    • Excel + AI Mastery: 100 Formulas
    • Excel Pivot Tables & Dashboards
  • About Us
  • Contact Us
Copyright © 2023 PK-AnExcelExpert.com - Privacy Policy