New: NextGenTemplates Academy - video courses on Excel formulas with AI and Pivot Tables & dashboards. Early-bird: 20% off with code EARLYBIRD20 - first 20 orders only. See the courses →
  • Learn Excel (Free Course)
    • 1. Shortcut Keys
    • 2. Fill & Flash Fill
    • 3. Find & Replace
    • 4. Sort & Filter
    • 5. Formulas & Functions
    • 6. Data Validation
    • 7. Conditional Formatting
    • 8. Basic Charts
    • 9. Advanced Charts
    • 10. Pivot Tables
    • 11. Excel Dashboards
    • 12. VBA Course
    • 13. Excel Formulas with AI
  • Templates
  • Tutorials
    • Charts and Visualization
    • VBA
    • Excel Tips and Tricks
    • Excel Dashboards
    • Power Pivot & DAX
  • Power BI
  • Template Store
    • Ready to Use Templates
  • Courses
  • Academy
    • Excel + AI Mastery: 100 Formulas
    • Excel Pivot Tables & Dashboards
  • About Us
  • Contact Us

PK: An Excel Expert

Transforming Data into Decisions

Tag: Budget vs Actual Dashboard

Dashboard Power BI

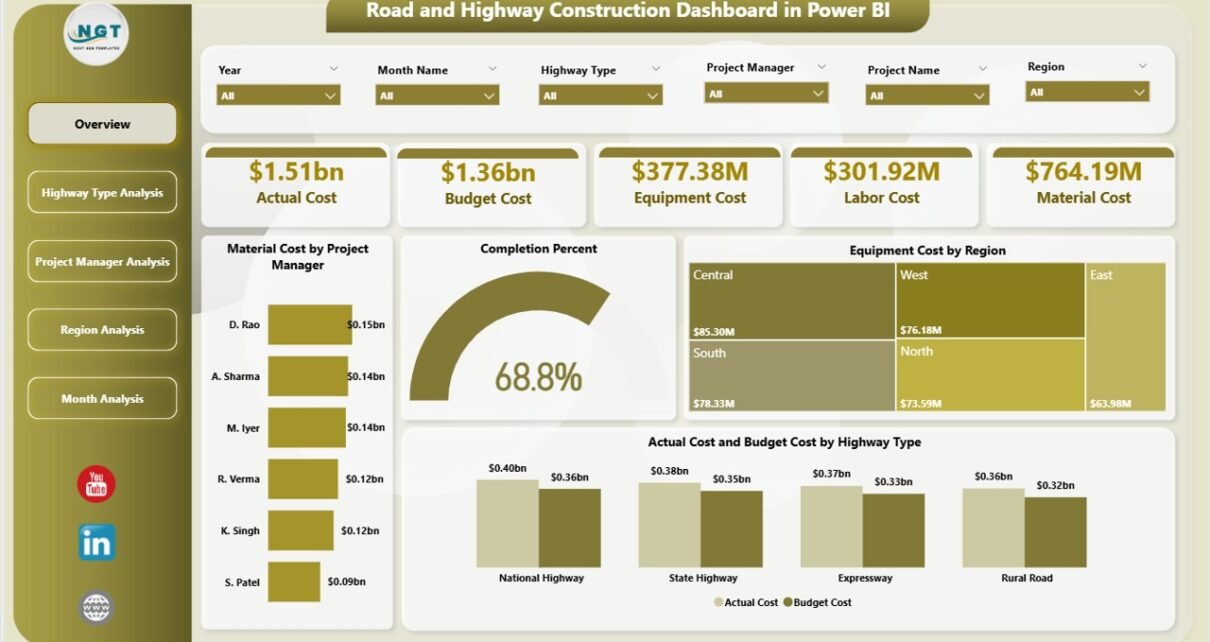
Road and Highway Construction Dashboard in Power BI

February 16, 2026February 16, 2026 PKComments Off on Road and Highway Construction Dashboard in Power BI
Road and highway construction projects demand precision. Costs rise fast. Deadlines shift often. Resources move across regions. Therefore, project leaders need complete visibility at every stage. However, many companies still
Read More
Dashboard Power BI

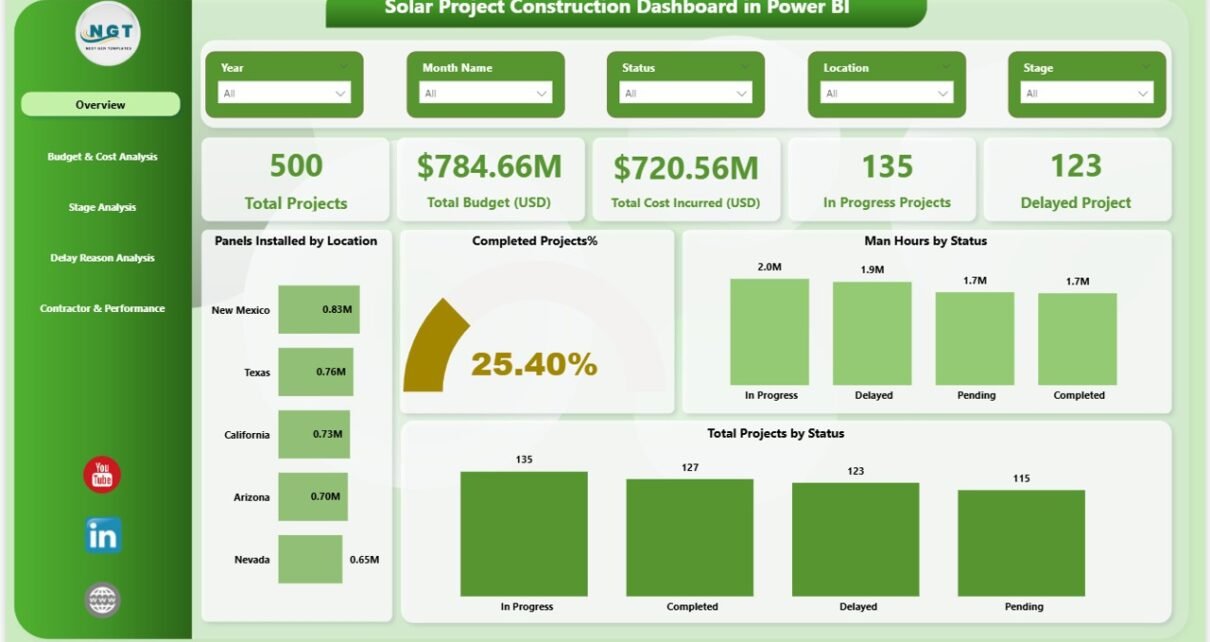
Solar Project Construction Dashboard in Power BI

February 13, 2026February 13, 2026 PKComments Off on Solar Project Construction Dashboard in Power BI
The solar industry grows faster every year. Governments promote renewable energy. Investors expect strong returns. Developers manage multiple sites at once. However, many solar companies still track construction progress using
Read More
Dashboard Power BI

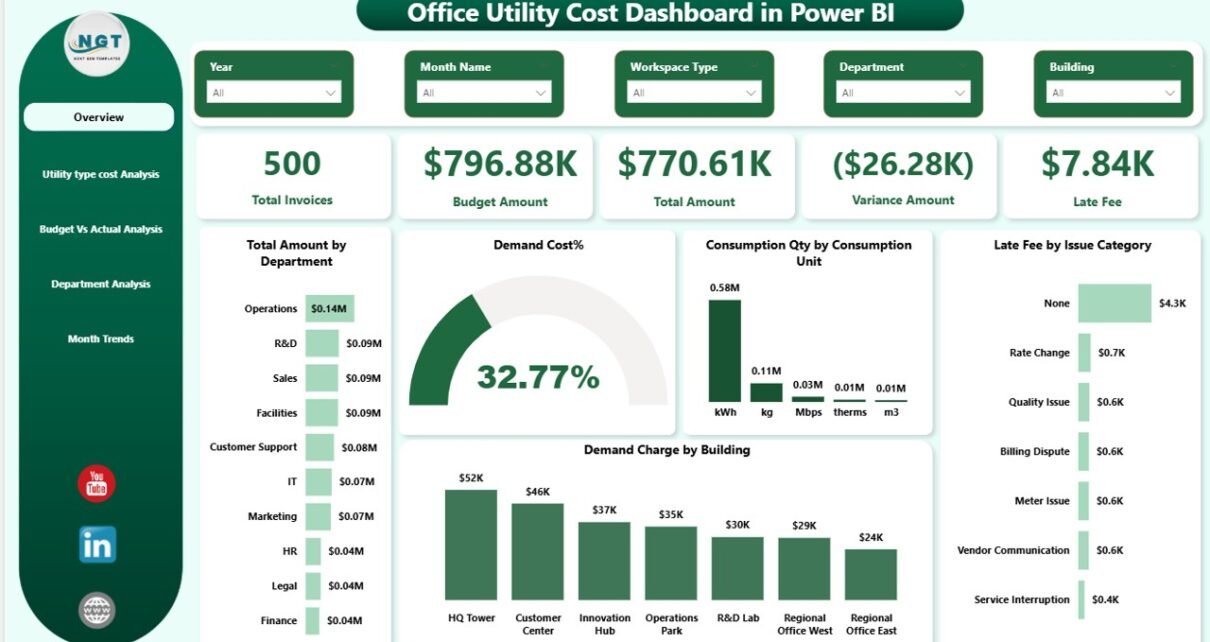
Office Utility Cost Dashboard in Power BI

February 10, 2026February 10, 2026 PKComments Off on Office Utility Cost Dashboard in Power BI
Managing office utility costs has become more important than ever. Energy prices continue to rise. Water tariffs keep changing. Demand charges increase without warning. As a result, businesses struggle to
Read More
Dashboard Power BI

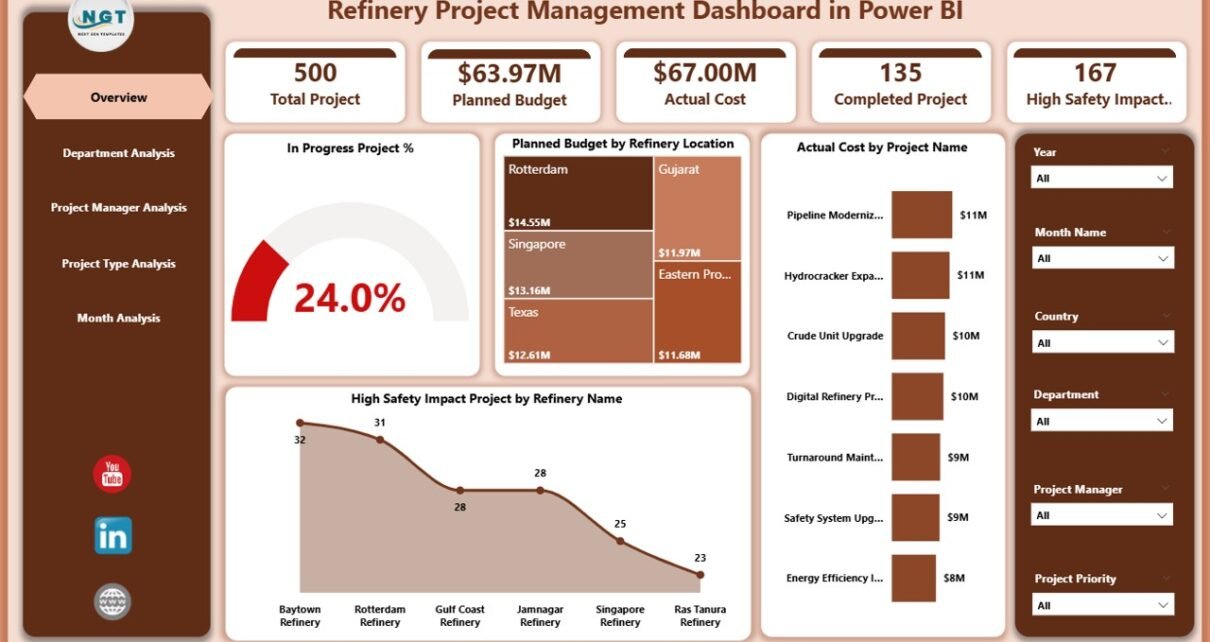
Refinery Project Management Dashboard in Power BI

December 26, 2025December 26, 2025 PKComments Off on Refinery Project Management Dashboard in Power BI
Managing refinery projects without clear visibility often creates cost overruns, safety risks, and missed deadlines. However, when organizations use a Refinery Project Management Dashboard in Power BI, they gain real-time
Read More
Dashboard

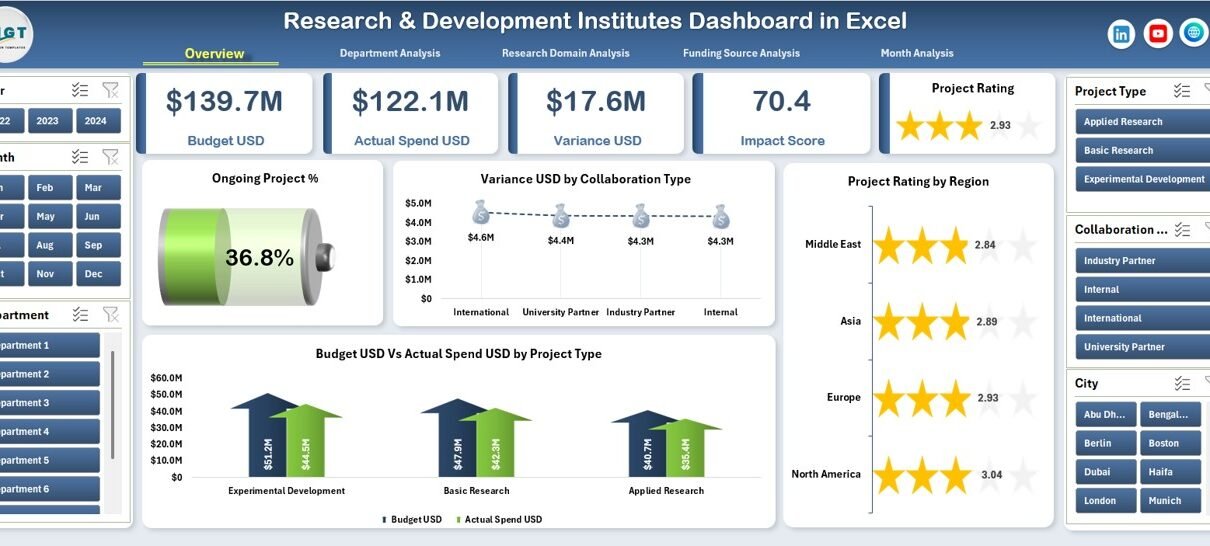
Research & Development Institutes Dashboard in Excel

December 12, 2025December 12, 2025 PKComments Off on Research & Development Institutes Dashboard in Excel
Research and development (R&D) institutes play a critical role in innovation, scientific growth, and technological advancement. However, managing multiple projects, departments, research domains, and funding sources becomes challenging without a
Read More
  • Learn Excel (Free Course)
    • 1. Shortcut Keys
    • 2. Fill & Flash Fill
    • 3. Find & Replace
    • 4. Sort & Filter
    • 5. Formulas & Functions
    • 6. Data Validation
    • 7. Conditional Formatting
    • 8. Basic Charts
    • 9. Advanced Charts
    • 10. Pivot Tables
    • 11. Excel Dashboards
    • 12. VBA Course
    • 13. Excel Formulas with AI
  • Templates
  • Tutorials
    • Charts and Visualization
    • VBA
    • Excel Tips and Tricks
    • Excel Dashboards
    • Power Pivot & DAX
  • Power BI
  • Template Store
    • Ready to Use Templates
  • Courses
  • Academy
    • Excel + AI Mastery: 100 Formulas
    • Excel Pivot Tables & Dashboards
  • About Us
  • Contact Us
Copyright © 2023 PK-AnExcelExpert.com - Privacy Policy