New: NextGenTemplates Academy - video courses on Excel formulas with AI and Pivot Tables & dashboards. Early-bird: 20% off with code EARLYBIRD20 - first 20 orders only. See the courses →
  • Learn Excel (Free Course)
    • 1. Shortcut Keys
    • 2. Fill & Flash Fill
    • 3. Find & Replace
    • 4. Sort & Filter
    • 5. Formulas & Functions
    • 6. Data Validation
    • 7. Conditional Formatting
    • 8. Basic Charts
    • 9. Advanced Charts
    • 10. Pivot Tables
    • 11. Excel Dashboards
    • 12. VBA Course
    • 13. Excel Formulas with AI
  • Templates
  • Tutorials
    • Charts and Visualization
    • VBA
    • Excel Tips and Tricks
    • Excel Dashboards
    • Power Pivot & DAX
  • Power BI
  • Template Store
    • Ready to Use Templates
  • Courses
  • Academy
    • Excel + AI Mastery: 100 Formulas
    • Excel Pivot Tables & Dashboards
  • About Us
  • Contact Us

PK: An Excel Expert

Transforming Data into Decisions

Tag: Business Intelligence Power BI

Power BI

Floriculture KPI Dashboard in Power BI

December 15, 2025December 15, 2025 PKComments Off on Floriculture KPI Dashboard in Power BI
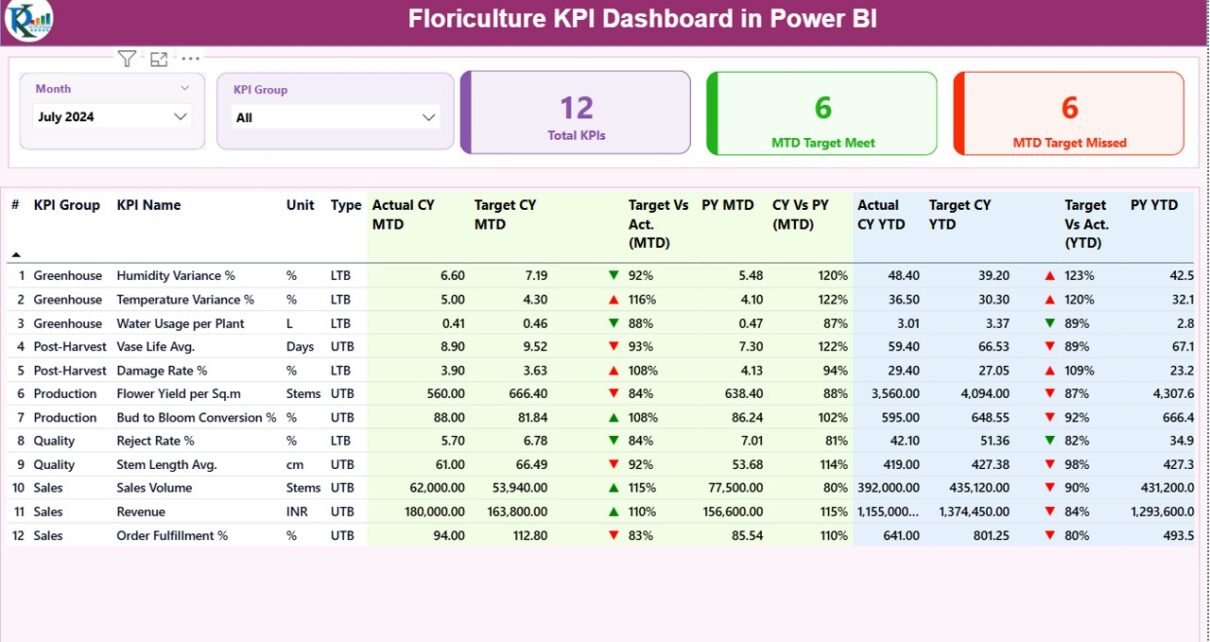
The floriculture industry operates in a highly dynamic environment where demand patterns change quickly, perishability remains high, and margins depend heavily on efficiency and timing. Therefore, floriculture businesses must track
Read More
Power BI

Digital Media Agencies KPI Dashboard in Power BI

December 13, 2025December 13, 2025 PKComments Off on Digital Media Agencies KPI Dashboard in Power BI
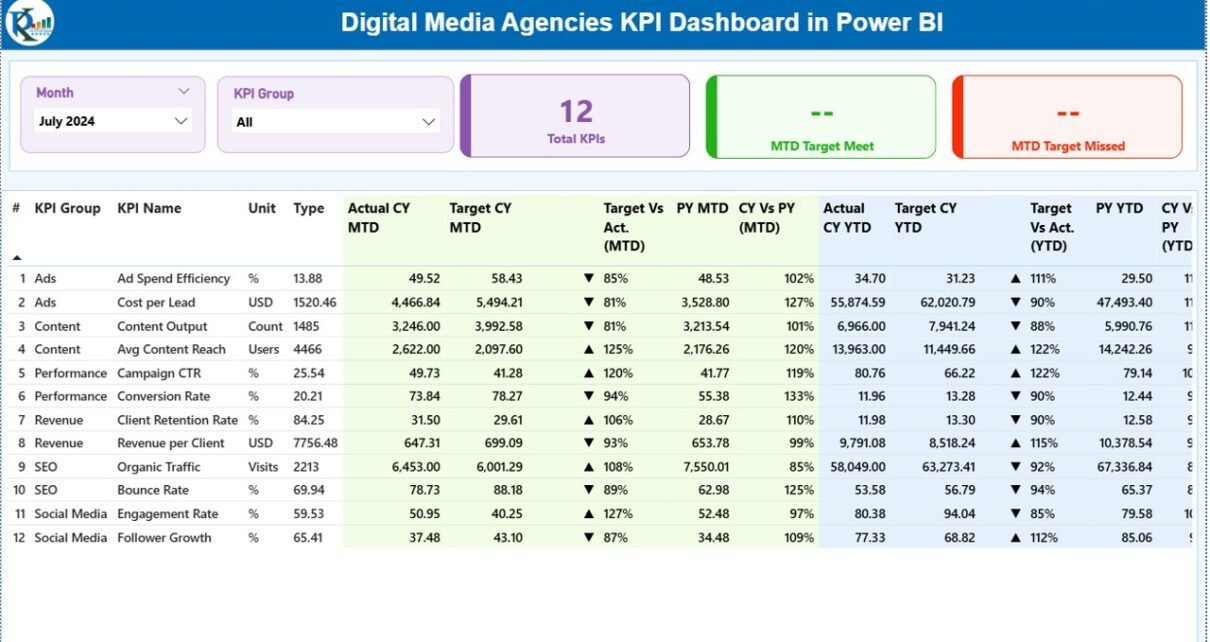
In today’s fast-moving digital world, digital media agencies must track performance continuously. Campaign results change daily, client expectations rise constantly, and competition grows stronger every month. Therefore, agencies need a
Read More
Dashboard Power BI

Shipbuilding Dashboard in Power BI

December 13, 2025December 13, 2025 PKComments Off on Shipbuilding Dashboard in Power BI
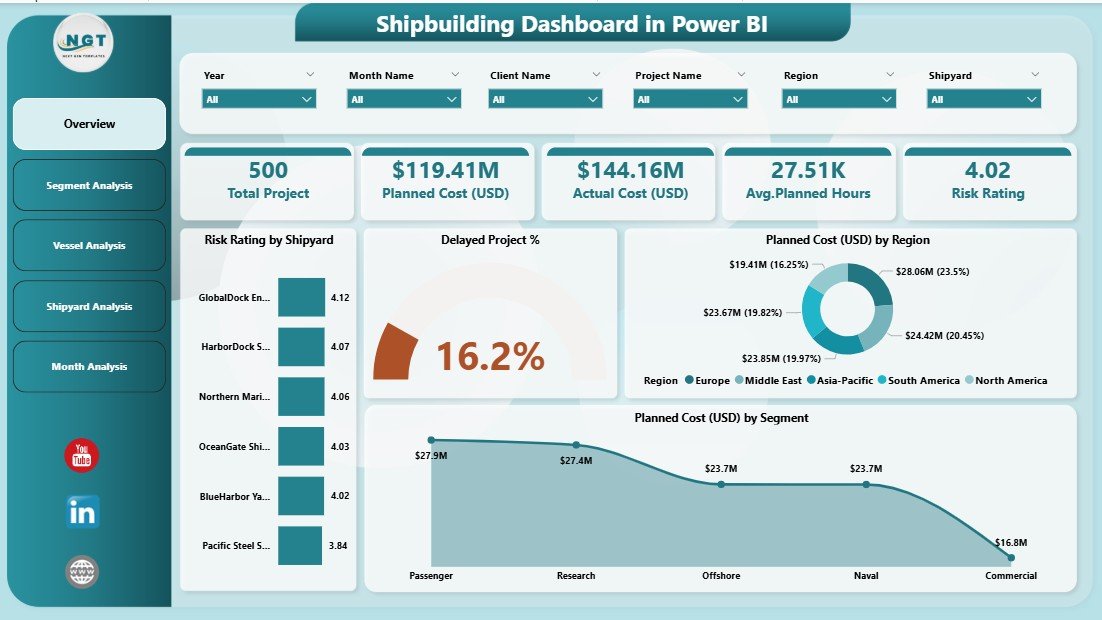
Managing shipbuilding projects demands precision, visibility, and continuous monitoring. However, shipyards often struggle with scattered data, delayed reporting, and limited insights. As a result, decision-makers face challenges in controlling costs,
Read More
Power BI

Animation & VFX KPI Dashboard in Power BI

December 13, 2025December 13, 2025 PKComments Off on Animation & VFX KPI Dashboard in Power BI
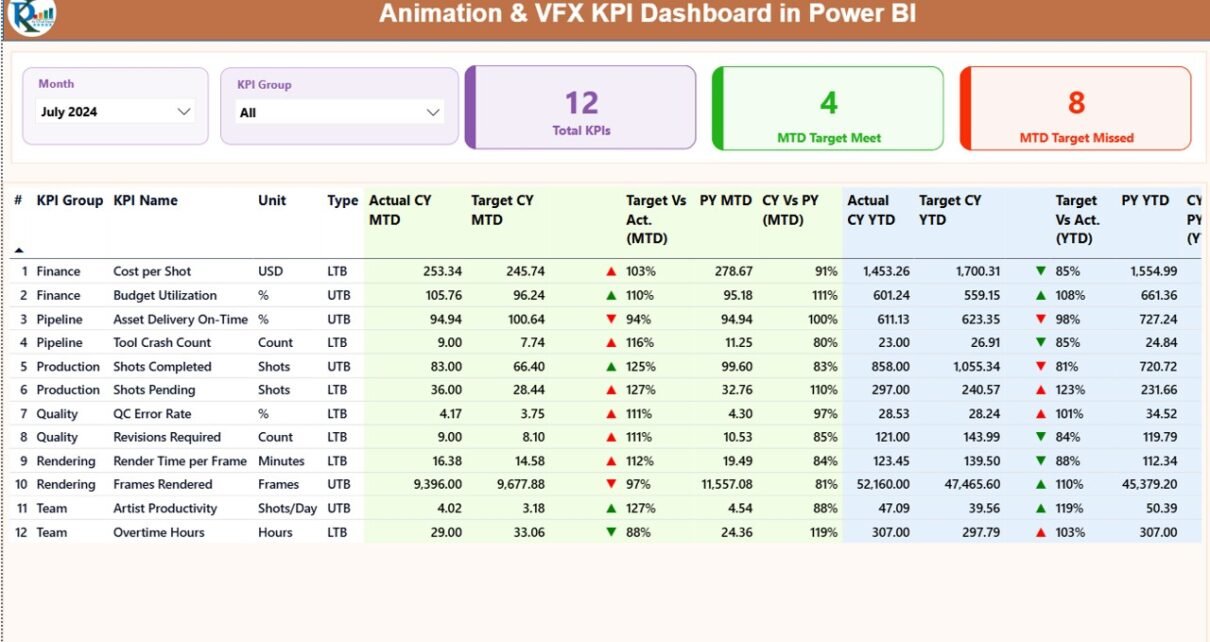
In today’s fast-moving animation and visual effects industry, studios face constant pressure to deliver high-quality output on time and within budget. At the same time, creative leaders, production managers, and
Read More

Posts pagination

Previous 1 … 4 5
  • Learn Excel (Free Course)
    • 1. Shortcut Keys
    • 2. Fill & Flash Fill
    • 3. Find & Replace
    • 4. Sort & Filter
    • 5. Formulas & Functions
    • 6. Data Validation
    • 7. Conditional Formatting
    • 8. Basic Charts
    • 9. Advanced Charts
    • 10. Pivot Tables
    • 11. Excel Dashboards
    • 12. VBA Course
    • 13. Excel Formulas with AI
  • Templates
  • Tutorials
    • Charts and Visualization
    • VBA
    • Excel Tips and Tricks
    • Excel Dashboards
    • Power Pivot & DAX
  • Power BI
  • Template Store
    • Ready to Use Templates
  • Courses
  • Academy
    • Excel + AI Mastery: 100 Formulas
    • Excel Pivot Tables & Dashboards
  • About Us
  • Contact Us
Copyright © 2023 PK-AnExcelExpert.com - Privacy Policy