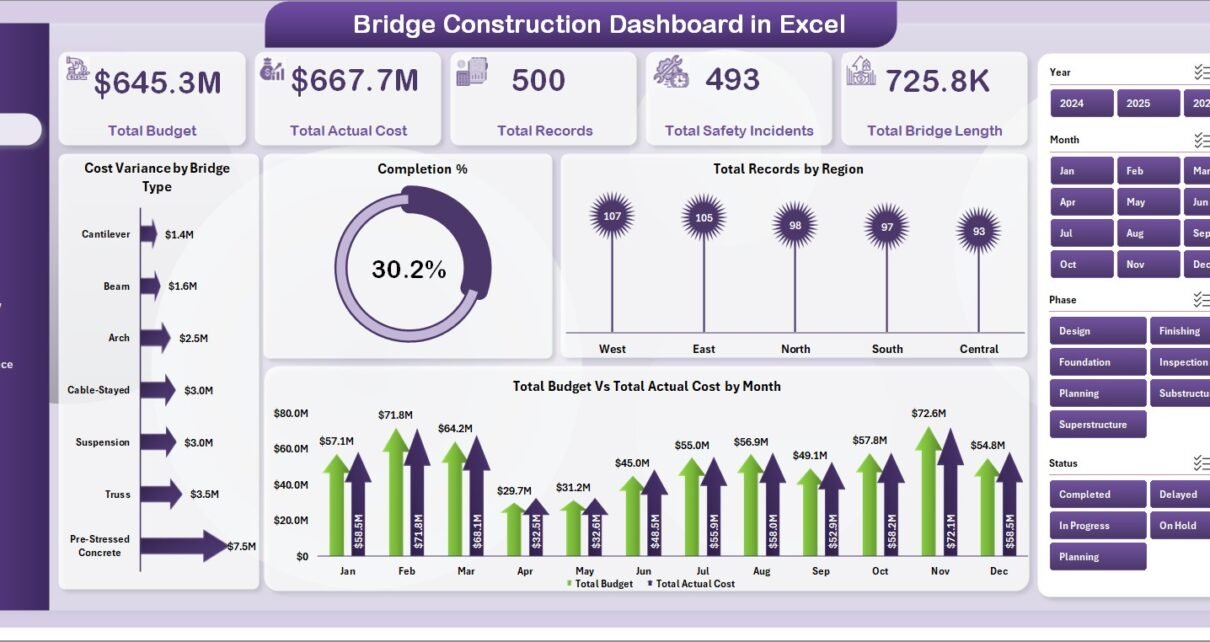
Bridge Construction Dashboard in Excel
Bridge construction projects demand precise tracking across dozens of moving variables — budget allocations, contractor performance, safety incidents, completion milestones, and regional cost variances — all at once. According