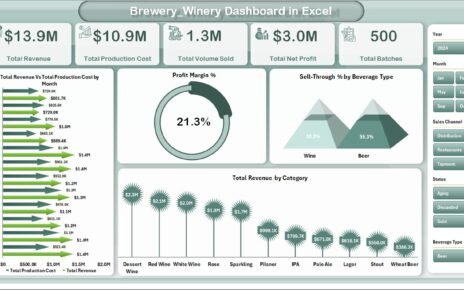
Construction Project Cost Dashboard in Excel is a powerful, pivot-driven analytics template designed for construction professionals who need to monitor budgets, track actual costs, analyze cost variances, and manage resources across multiple projects. Whether you are a project manager overseeing a commercial build, a cost engineer tracking contractor spending, or a finance director reviewing budget utilization, this Excel dashboard gives you instant visibility into every financial and operational dimension of your construction portfolio.Construction Project Cost Dashboard in Excel.
This template includes 5 interactive dashboard pages, a dedicated data sheet, and a support sheet containing all the pivot tables that drive the analytics. With 5 high-level KPI cards and 15+ dynamic charts powered by slicers and filters, you can drill down into phases, cost categories, contractors, regions, project managers, and time periods with a single click. The Construction Project Cost Dashboard in Excel tracks Total Budget, Total Actual Cost, Total Cost Variance, Total Records, and Budget Utilization % across your entire project portfolio.
Click here to Purchase Construction Project Cost Dashboard in Excel
Key Features of Construction Project Cost Dashboard in Excel
The Construction Project Cost Dashboard in Excel comes packed with features that make it one of the most comprehensive construction cost tracking solutions available as a ready-to-use Excel template. Here is what makes this dashboard stand out from other construction management tools:
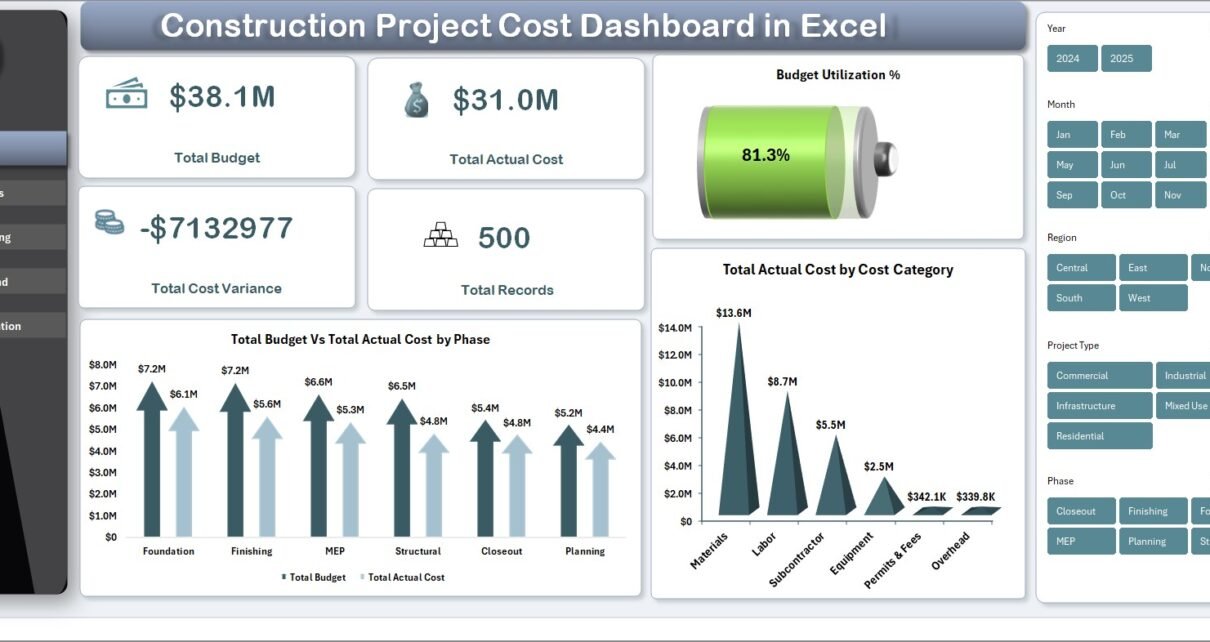
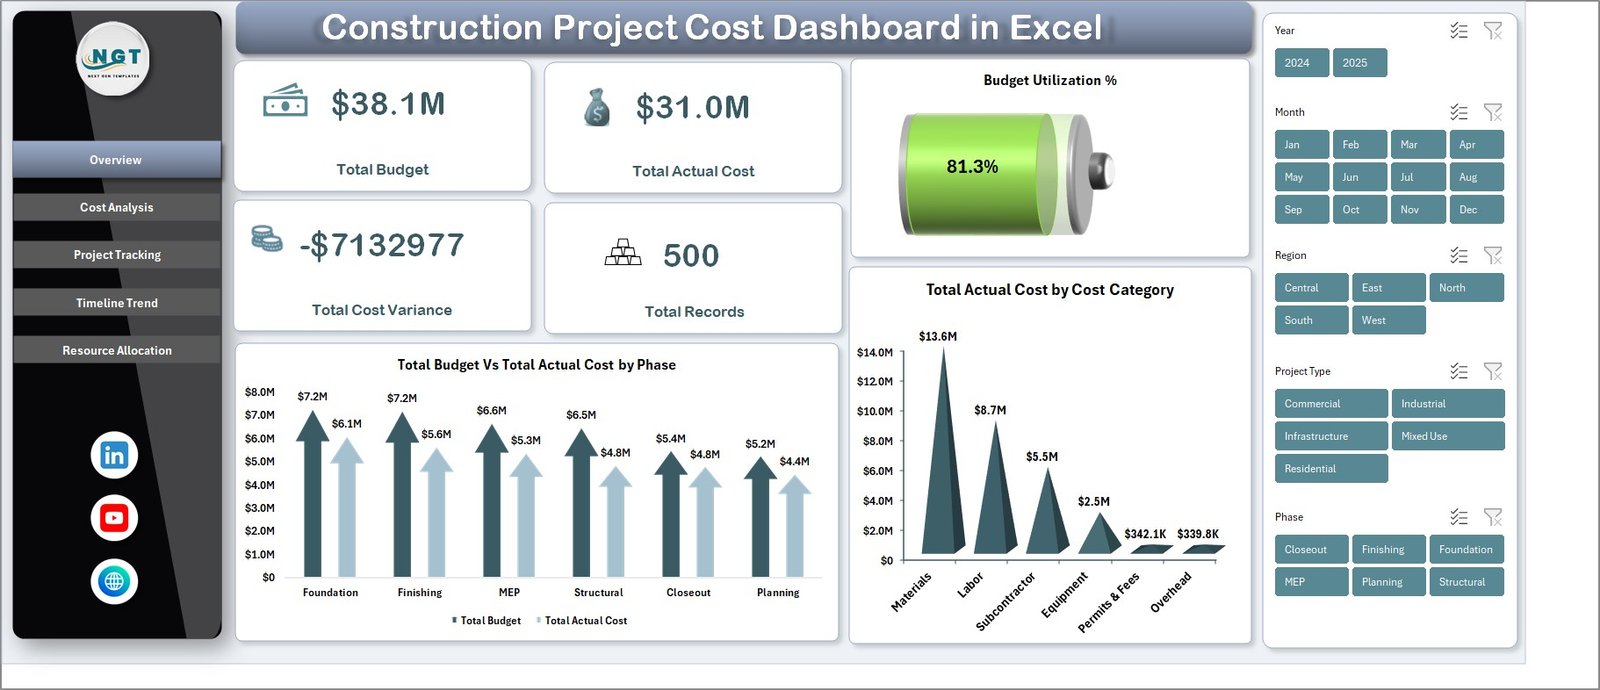
The dashboard includes 5 fully interactive pages covering Overview, Cost Analysis, Project Tracking, Timeline Trend, and Resource Allocation. Each page is purpose-built to answer specific questions about your construction project costs. The Overview page displays 5 KPI cards showing Total Budget, Total Actual Cost, Total Cost Variance, Total Records, and Budget Utilization %, giving you an instant executive summary of your project financial health.
Dynamic slicers let you filter the entire dashboard by Phase, Cost Category, Contractor, Region, Project Manager, Status, Priority, and Project Type. The entire dashboard is built on pivot tables stored in the Support sheet, so updating your data and clicking Refresh All in Excel updates every chart and KPI automatically.Construction Project Cost Dashboard
If you are looking for more Excel Dashboard Templates, explore our complete collection for every industry and department.
Click to buy Construction Project Cost Dashboard in Excel
Dashboard Pages Explained
1. Overview Page
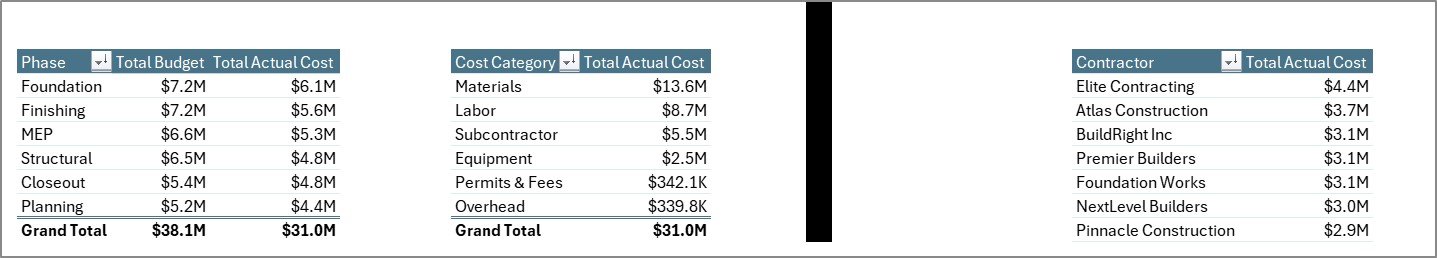
The Overview page is your command center for construction cost monitoring. At the top, 5 KPI cards display Total Budget, Total Actual Cost, Total Cost Variance, Total Records, and Budget Utilization %. Below these cards, interactive charts present Total Budget Vs Total Actual Cost by Phase, comparing planned versus actual spending across construction stages. The Total Actual Cost by Cost Category chart shows how expenses are distributed across material, labor, equipment, and other categories. Multiple slicers let you filter the entire dashboard instantly by any dimension.
Construction Project Cost Dashboard in Excel2. Cost Analysis Page
The Cost Analysis page lets you dive deep into spending patterns across your construction portfolio. It includes charts for Total Actual Cost by Contractor, revealing which contractors consume the most budget and helping you negotiate better rates. Total Cost Variance by Cost Category highlights where overruns or savings occur across materials, labor, equipment, and subcontracting. Total Budget by Region compares geographic spending distribution across your project locations, enabling better regional resource planning.
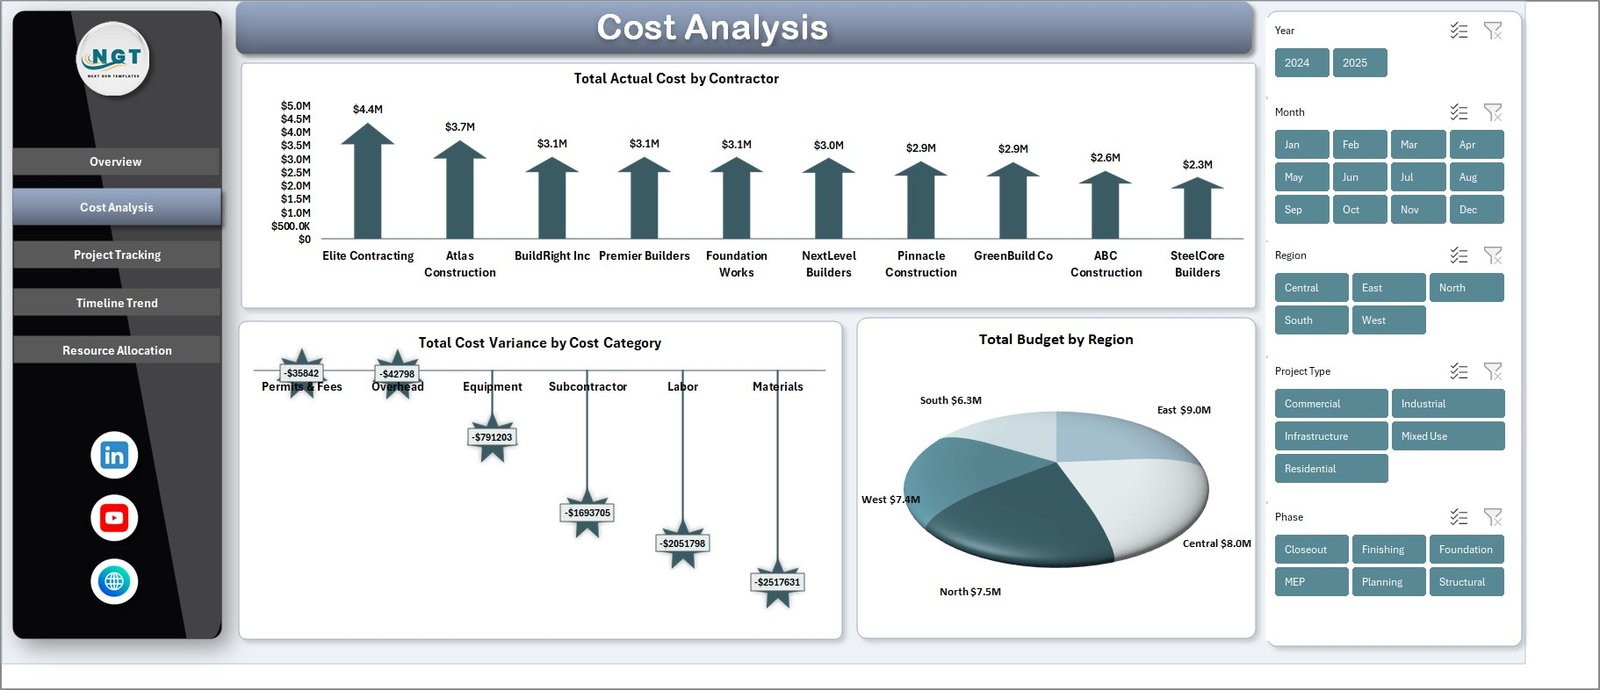 Cost Analysis Page
3. Project Tracking Page
The Project Tracking page monitors project execution health with charts for Total Actual Cost by Project Manager, tracking individual manager performance and accountability. Total Records by Status shows the breakdown of active, completed, and delayed projects. Total Records by Priority reveals how projects are distributed by urgency level, helping you allocate resources to high-priority items. Total Completed Vs Total Delayed by Project Type compares on-time delivery rates across different construction categories such as residential, commercial, and industrial.Construction Project Cost Dashboard in Excel
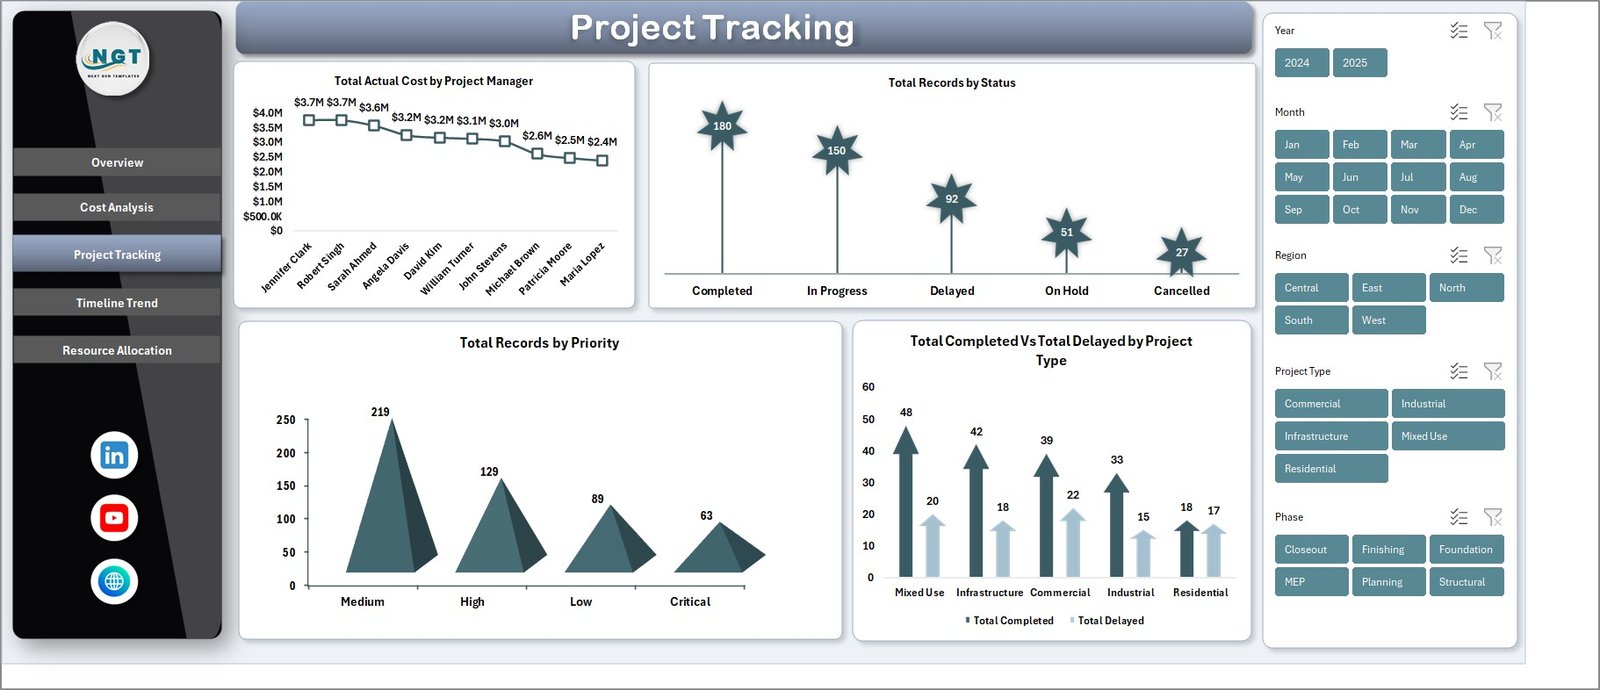 Project Tracking Page
4. Timeline Trend Page
The Timeline Trend page tracks time-based financial and operational patterns. Total Actual Cost Vs Total Budget by Year provides year-over-year budget compliance analysis so you can spot spending trends early. Total Labor Hours by Month shows workforce utilization trends across the calendar year. Total Labor Hours by Phase reveals labor distribution across construction stages like foundation, structural, finishing, and commissioning. Total Change Orders by Month monitors scope changes and their frequency over time, helping you manage project scope creep effectively.
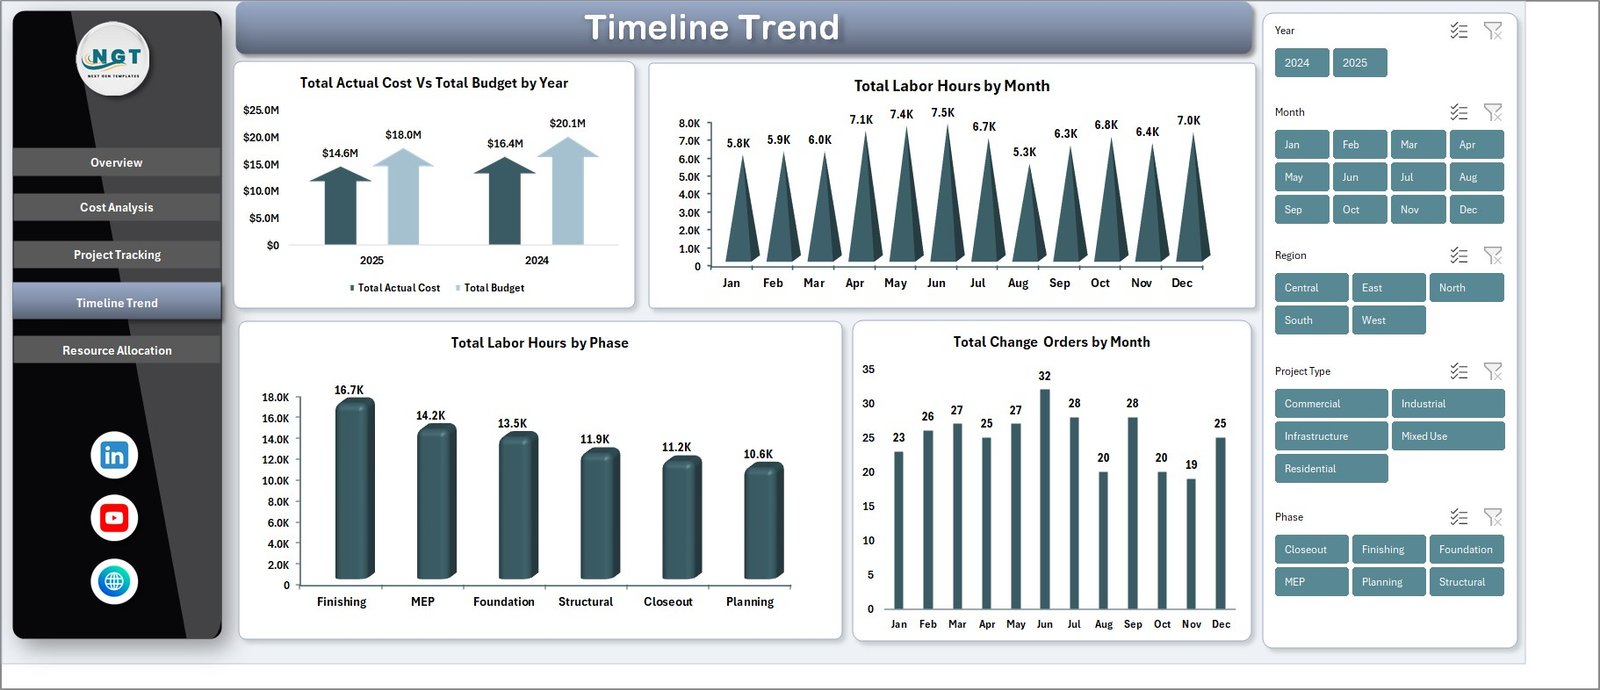 Timeline Trend Page
5. Resource Allocation Page
The Resource Allocation page helps you optimize workforce deployment and budget distribution. Total Labor Hours by Contractor compares labor contributions across your contractor pool, identifying which contractors deliver the most work. Total Budget by Project Type analyzes budget distribution by construction category. Total Labor Hours by Project Name identifies which specific projects consume the most labor resources, enabling better staffing decisions.Construction Project Cost Dashboard in Excel
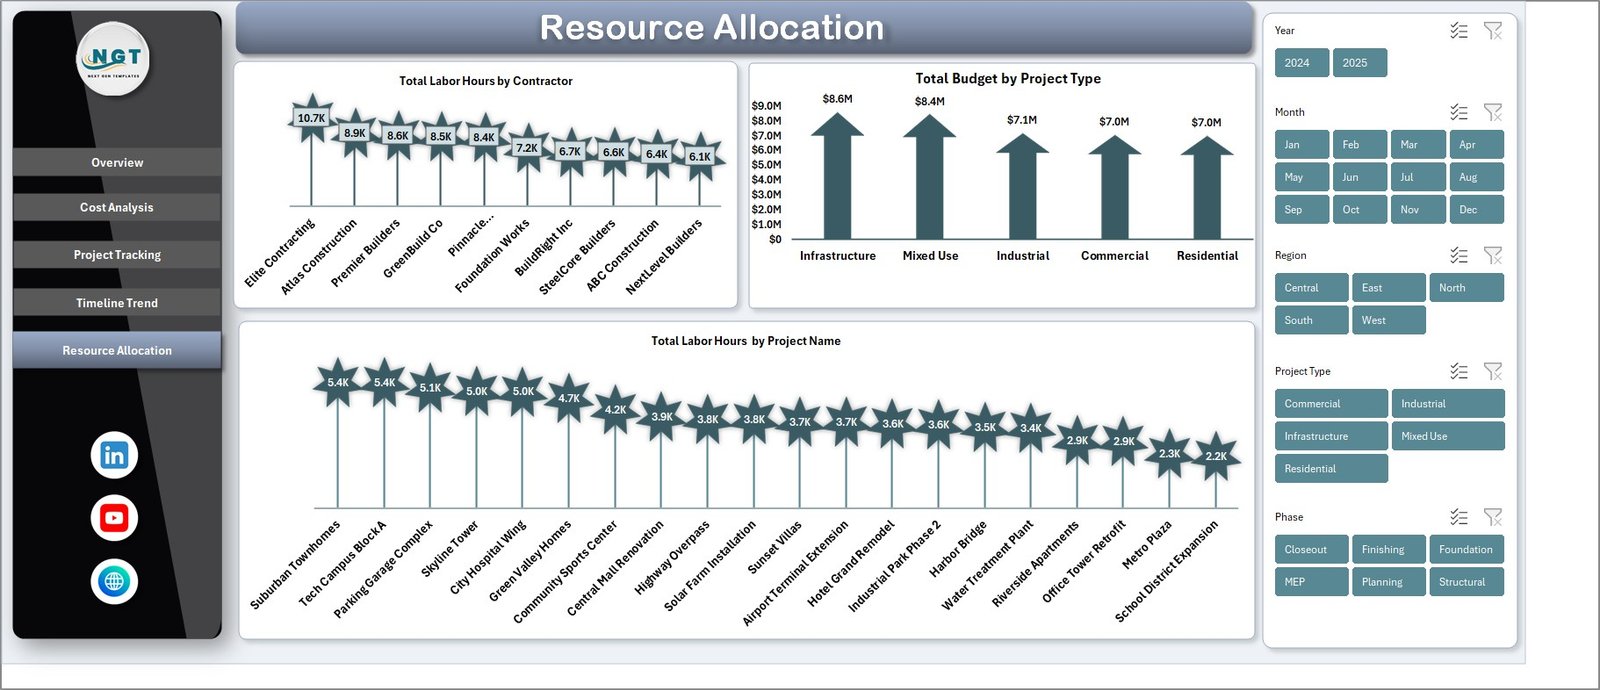 Resource Allocation Page
6. Data Sheet
The Data Sheet is where all your construction project records are stored. Simply add your project data in the same column format as the sample data. The columns include project details, phase, cost category, contractor, region, project manager, status, priority, budget, actual cost, labor hours, change orders, and more. After adding your data, the dashboard updates automatically when you click Refresh All.
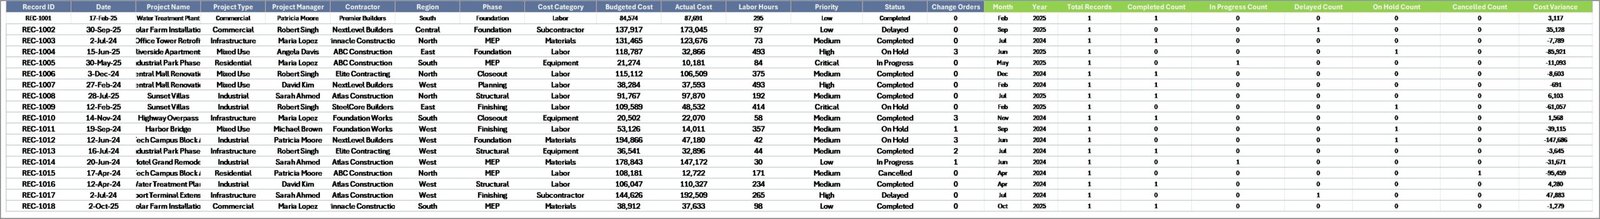 Data Sheet Tab
7. Support Sheet
The Support Sheet contains all the pivot tables that power the entire dashboard dynamically. You do not need to modify anything on this sheet. Simply go to the Data tab in the Excel Ribbon and click Refresh All after updating the data in the Data Sheet. All the pivots will be refreshed and all the charts will update automatically. You can keep this sheet hidden for a cleaner user experience.
 Support Sheet Tab
Advantages of Construction Project Cost Dashboard in Excel
The Construction Project Cost Dashboard in Excel provides several distinct advantages over manual reporting and generic spreadsheet tracking. First, it centralizes all cost data into one visual reporting system, eliminating the need to review multiple disconnected spreadsheets. Second, the pivot-powered architecture means every chart and KPI updates automatically when you refresh the data, saving hours of manual report preparation every week.
Third, the interactive slicers allow managers to perform ad-hoc analysis instantly without modifying formulas or creating new charts. Fourth, having dedicated pages for cost analysis, project tracking, timeline trends, and resource allocation ensures that different stakeholders can find the specific insights they need quickly. Finally, the template works in standard Microsoft Excel without requiring any add-ins, VBA macros, or external software, making it accessible to teams with varying technical skill levels.
Opportunities for Improvement
While the dashboard covers a wide range of construction cost analytics, there are areas where users might want to extend its capabilities. Adding a dedicated safety incident tracking page would benefit organizations that monitor both cost and safety KPIs in one place. Incorporating earned value management metrics like CPI and SPI would provide deeper project performance insights for large-scale infrastructure projects. Users managing international projects might benefit from multi-currency support with automatic conversion rates. Additionally, adding conditional formatting rules to highlight budget overruns in red directly on the KPI cards would provide even faster visual alerts.
Best Practices for Using This Dashboard
To get the most value from the Construction Project Cost Dashboard in Excel, update your data regularly, ideally weekly or bi-weekly, to maintain accurate real-time insights. Use consistent naming conventions for contractors, project types, and cost categories to ensure the slicers and pivot tables group data correctly. Review the Overview page first for a high-level summary, then drill into specific pages for detailed analysis. Share the dashboard file with stakeholders via email or shared drives so everyone works from the same data source. Keep the Support Sheet hidden to prevent accidental modifications to the pivot tables.
Explore Relevant Templates
If you found this dashboard useful, here are some related templates that complement your construction project management toolkit:
Construction Dashboard in HTML — A browser-based interactive dashboard for tracking construction project progress, budgets, safety incidents, and timelines without needing Excel.
Construction Project Timeline Calendar in Excel — Plan and track construction project milestones with annual, monthly, and daily calendar views featuring event management and color themes.
Infrastructure KPI Scorecard in Google Sheets — Monitor infrastructure performance KPIs with automated traffic-light indicators, trend analysis, and cloud-based collaboration.
Urban Metro Development KPI Dashboard in Power BI — Track metro infrastructure KPIs with interactive Power BI visuals for MTD, YTD, and target vs actual analysis.
Frequently Asked Questions
What is the best Excel template for tracking construction project costs?
The Construction Project Cost Dashboard in Excel by NextGenTemplates is one of the best options for tracking construction project costs. It includes 5 interactive dashboard pages, 5 KPI cards, 15+ dynamic charts, and pivot-powered auto-refresh functionality. The template covers budget analysis, cost tracking by contractor and category, project status monitoring, timeline trends, and resource allocation in a single Excel file.
How do I update the dashboard with my own construction data?
Simply open the Data Sheet, replace the sample records with your own construction project data following the same column format, then go to the Data tab in Excel and click Refresh All. Every pivot table, chart, and KPI card will update automatically with your new data. No formulas or VBA knowledge is required.
Can I track construction costs by contractor and project phase?
Yes. The dashboard includes interactive slicers that let you filter by Contractor, Phase, Cost Category, Region, Project Manager, Status, Priority, and Project Type. The Cost Analysis page specifically shows Total Actual Cost by Contractor and Total Cost Variance by Cost Category for detailed spending analysis.
Does this dashboard require Excel macros or VBA?
No. The Construction Project Cost Dashboard in Excel is built entirely on native Excel pivot tables, charts, and slicers. It does not use any VBA macros, so you do not need to enable macros when opening the file. It works in Microsoft Excel 2016 and later versions.
What KPIs does this construction dashboard track?
The dashboard tracks 5 key performance indicators on the Overview page: Total Budget, Total Actual Cost, Total Cost Variance, Total Records, and Budget Utilization %. Additionally, it provides detailed analysis across 15+ charts covering cost breakdowns by phase, category, contractor, region, project manager, project type, and time period.
Who should use this construction cost dashboard?
This dashboard is designed for construction project managers, cost engineers, general contractors, real estate developers, government infrastructure agencies, and finance teams who need to monitor construction project budgets, track actual spending, and optimize resource allocation using Excel.
Conclusion
The Construction Project Cost Dashboard in Excel is a must-have analytics tool for any construction professional who wants to take control of project budgets, monitor cost variances in real time, and make data-driven decisions. With 5 interactive pages, 5 KPI cards, dynamic slicers, and pivot-powered auto-refresh, this template transforms raw construction data into clear, actionable insights.
Click here to Purchase Construction Project Cost Dashboard in Excel
Visit our YouTube channel for step-by-step video tutorials: Youtube.com/@PK-AnExcelExpert