New: NextGenTemplates Academy - video courses on Excel formulas with AI and Pivot Tables & dashboards. Early-bird: 20% off with code EARLYBIRD20 - first 20 orders only. See the courses →
  • Learn Excel (Free Course)
    • 1. Shortcut Keys
    • 2. Fill & Flash Fill
    • 3. Find & Replace
    • 4. Sort & Filter
    • 5. Formulas & Functions
    • 6. Data Validation
    • 7. Conditional Formatting
    • 8. Basic Charts
    • 9. Advanced Charts
    • 10. Pivot Tables
    • 11. Excel Dashboards
    • 12. VBA Course
    • 13. Excel Formulas with AI
  • Templates
  • Tutorials
    • Charts and Visualization
    • VBA
    • Excel Tips and Tricks
    • Excel Dashboards
    • Power Pivot & DAX
  • Power BI
  • Template Store
    • Ready to Use Templates
  • Courses
  • Academy
    • Excel + AI Mastery: 100 Formulas
    • Excel Pivot Tables & Dashboards
  • About Us
  • Contact Us

PK: An Excel Expert

Transforming Data into Decisions

Tag: Project Management Dashboard

Dashboard Templates

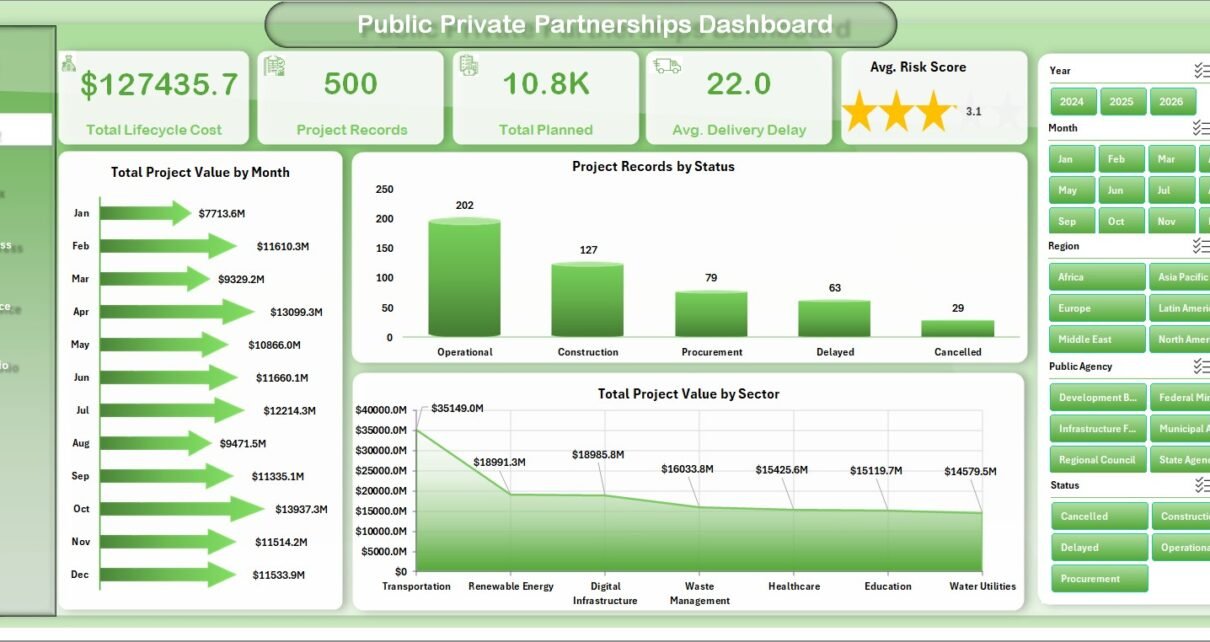
Public Private Partnerships Dashboard in Excel

July 29, 2026July 29, 2026 PKComments Off on Public Private Partnerships Dashboard in Excel
Public private partnerships are used for roads, utilities, hospitals, schools, transit systems, urban renewal, and many other capital-intensive public projects. These programs usually involve long timelines, layered funding, public agencies,
Read More
Dashboard

Construction Project Cost Dashboard in Excel

April 8, 2026April 8, 2026 PKComments Off on Construction Project Cost Dashboard in Excel
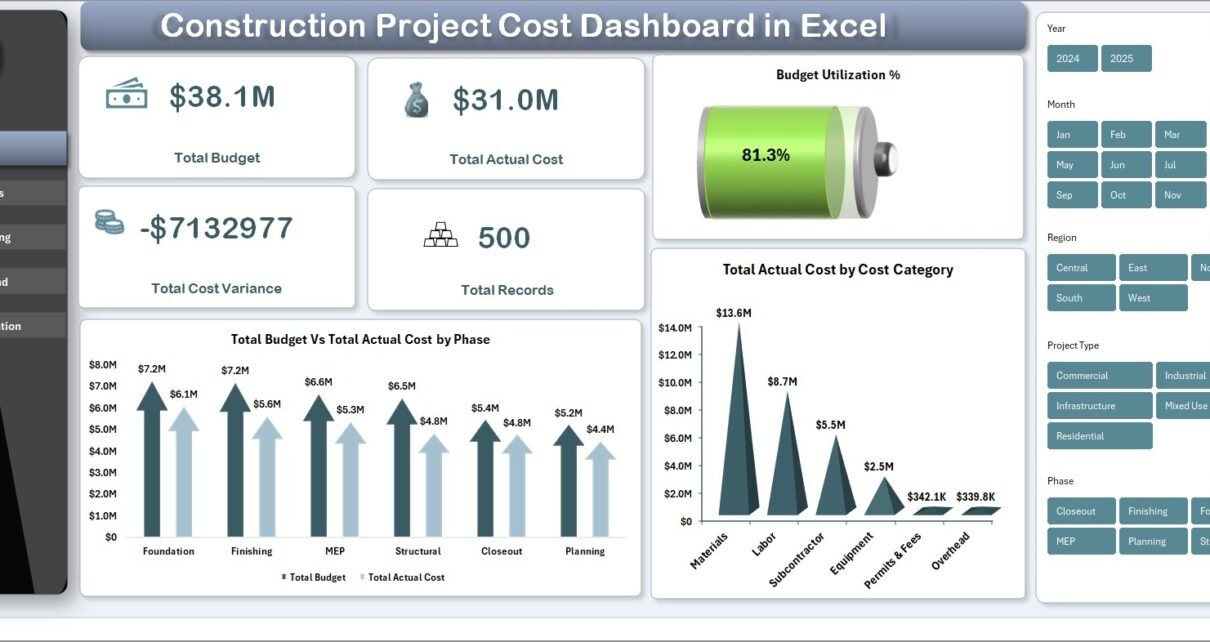
Construction Project Cost Dashboard in Excel is a powerful, pivot-driven analytics template designed for construction professionals who need to monitor budgets, track actual costs, analyze cost variances, and manage resources
Read More
Dashboard Power BI

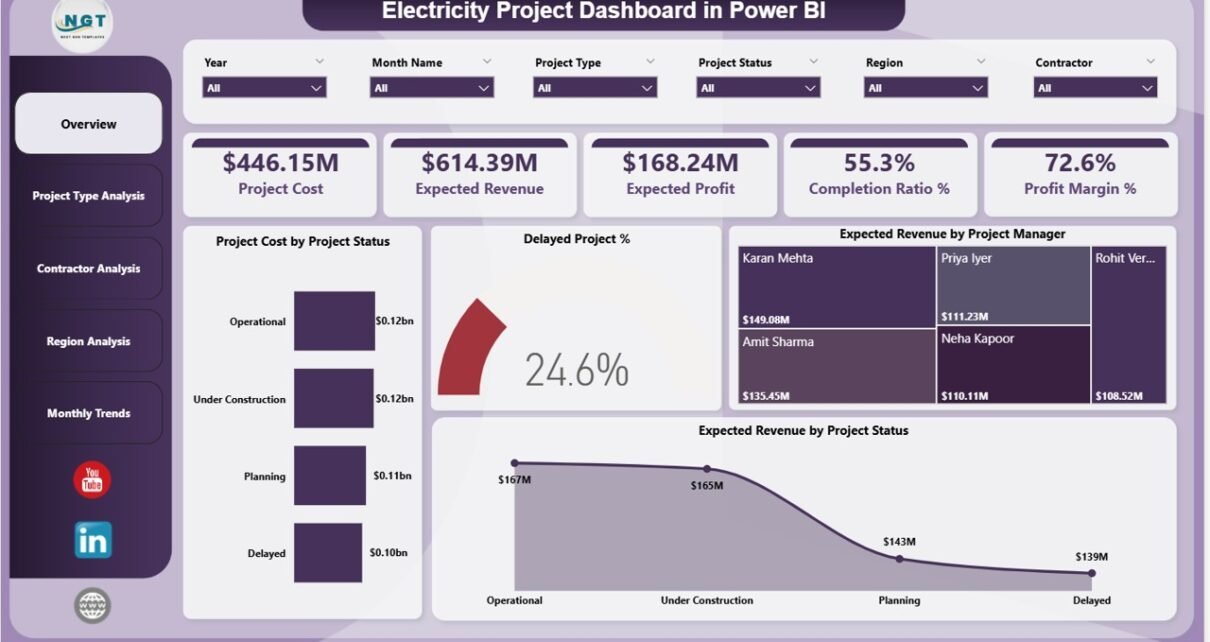
Electricity Project Dashboard in Power BI

March 10, 2026March 10, 2026 PKComments Off on Electricity Project Dashboard in Power BI
Electricity projects require huge investments, complex planning, and strong coordination among engineers, contractors, project managers, and stakeholders. Power generation plants, transmission projects, renewable installations, and infrastructure upgrades often involve multiple
Read More
Dashboard

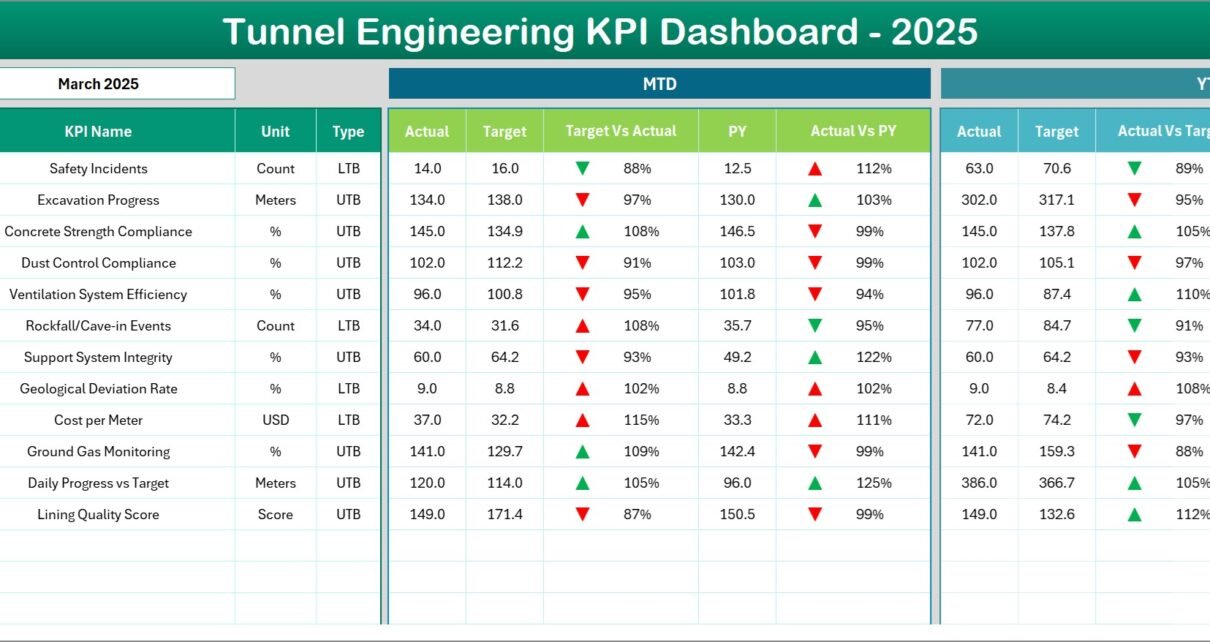
Tunnel Engineering KPI Dashboard in Excel

March 7, 2026March 7, 2026 PKComments Off on Tunnel Engineering KPI Dashboard in Excel
Tunnel engineering projects involve complex planning, strict safety standards, and continuous monitoring of construction activities. Engineers, project managers, and infrastructure authorities must track multiple performance indicators to ensure projects progress
Read More
Power BI

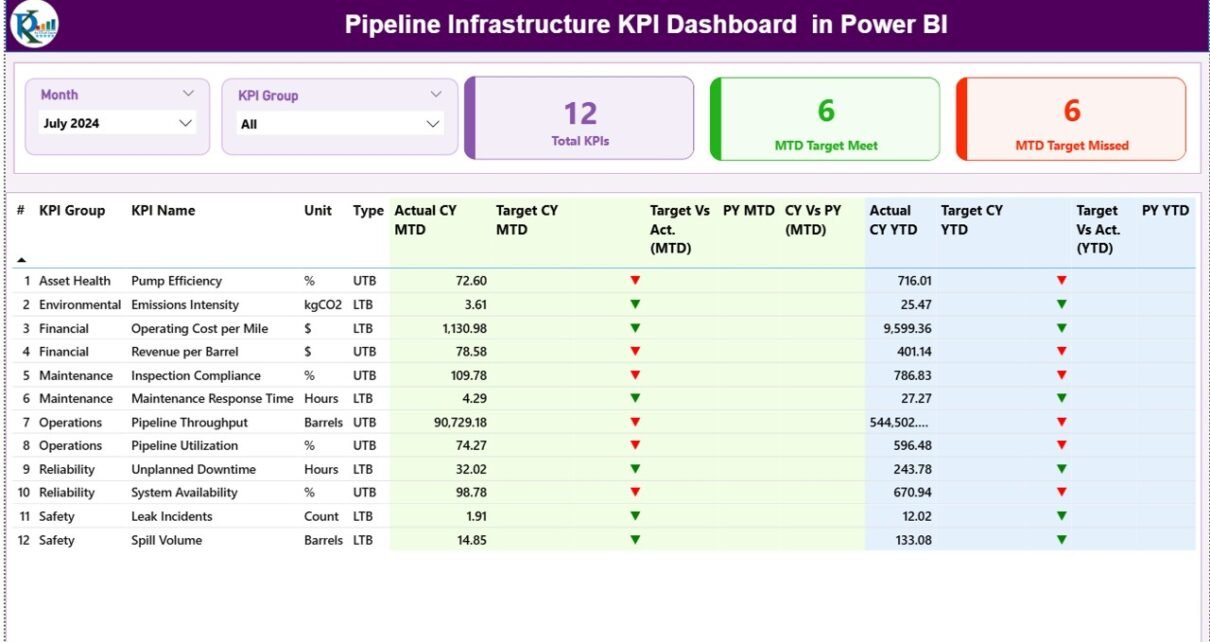
Pipeline Infrastructure KPI Dashboard in Power BI

March 6, 2026March 6, 2026 PKComments Off on Pipeline Infrastructure KPI Dashboard in Power BI
Pipeline infrastructure projects involve complex planning, continuous monitoring, strict safety regulations, and large financial investments. Therefore, organizations must track performance metrics accurately to ensure operational efficiency and project success. However,
Read More
Dashboard Power BI

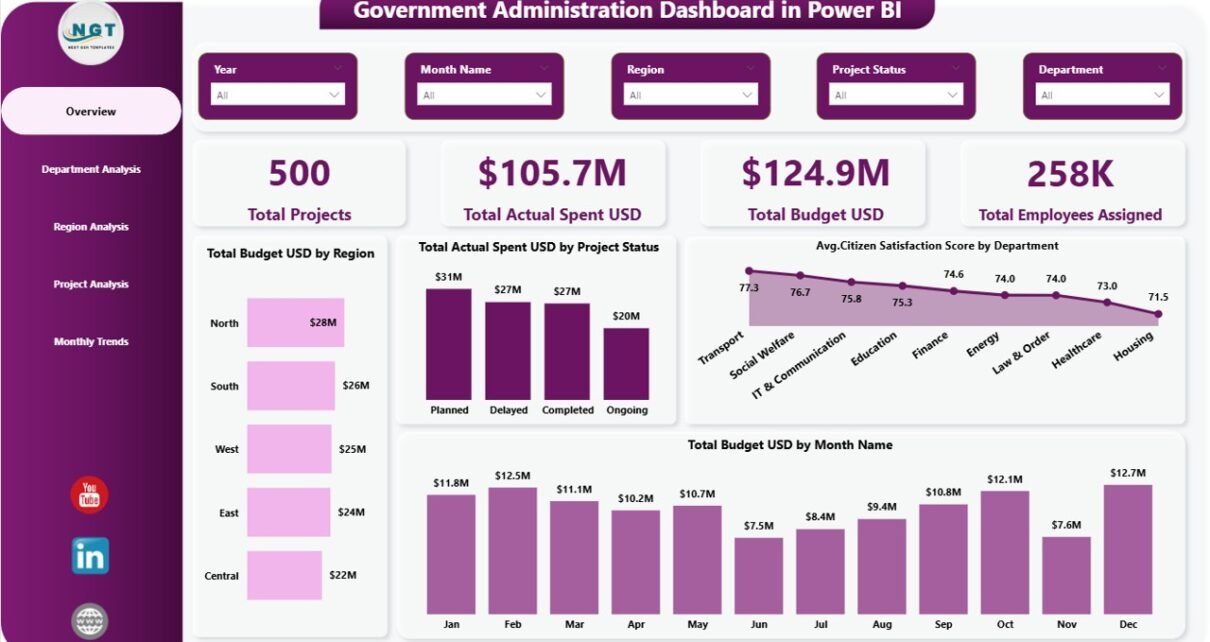
Government Administration Dashboard in Power BI

February 25, 2026February 25, 2026 PKComments Off on Government Administration Dashboard in Power BI
Government organizations manage hundreds of projects, departments, budgets, and public services every year. However, decision-makers often struggle because data remains scattered across spreadsheets, reports, and manual systems. As a result,
Read More
Dashboard Power BI

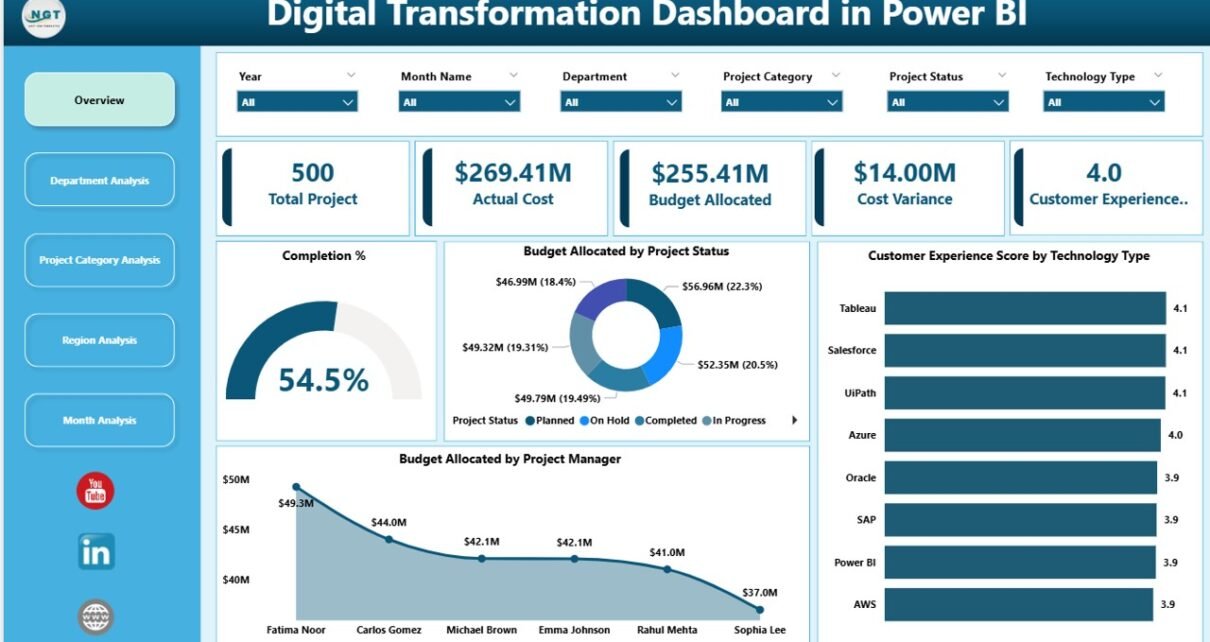
Digital Transformation Dashboard in Power BI

February 11, 2026February 11, 2026 PKComments Off on Digital Transformation Dashboard in Power BI
Digital transformation is no longer optional. Organizations compete in a fast-moving world. Customers expect speed. Teams demand automation. Leaders need visibility. However, many companies still track digital projects using scattered
Read More
Dashboard

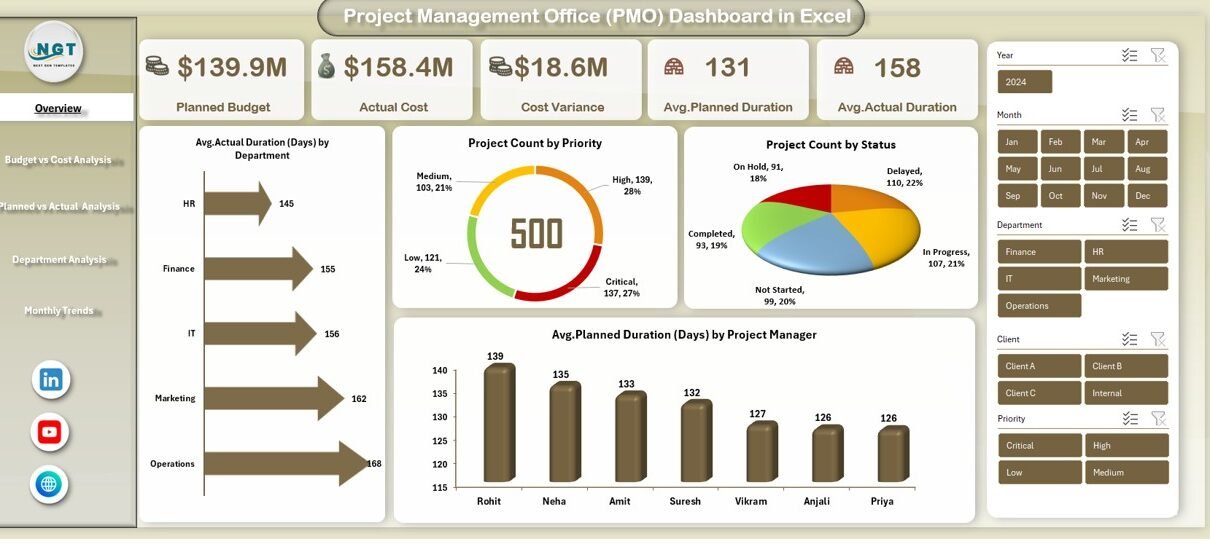
Project Management Office (PMO) Dashboard in Excel

January 13, 2026January 13, 2026 PKComments Off on Project Management Office (PMO) Dashboard in Excel
Managing multiple projects without clear visibility always creates confusion, delays, and cost overruns. Moreover, project managers, PMO heads, and leadership teams constantly struggle to track budgets, timelines, priorities, and performance
Read More
Dashboard Power BI

Smart Cities Project KPI Dashboard in Power BI

December 28, 2025December 28, 2025 PKComments Off on Smart Cities Project KPI Dashboard in Power BI
Managing smart city projects without a structured performance monitoring system often creates delays, cost overruns, and weak accountability. However, modern smart city initiatives involve complex infrastructure projects, multiple stakeholders, public
Read More
Dashboard Power BI

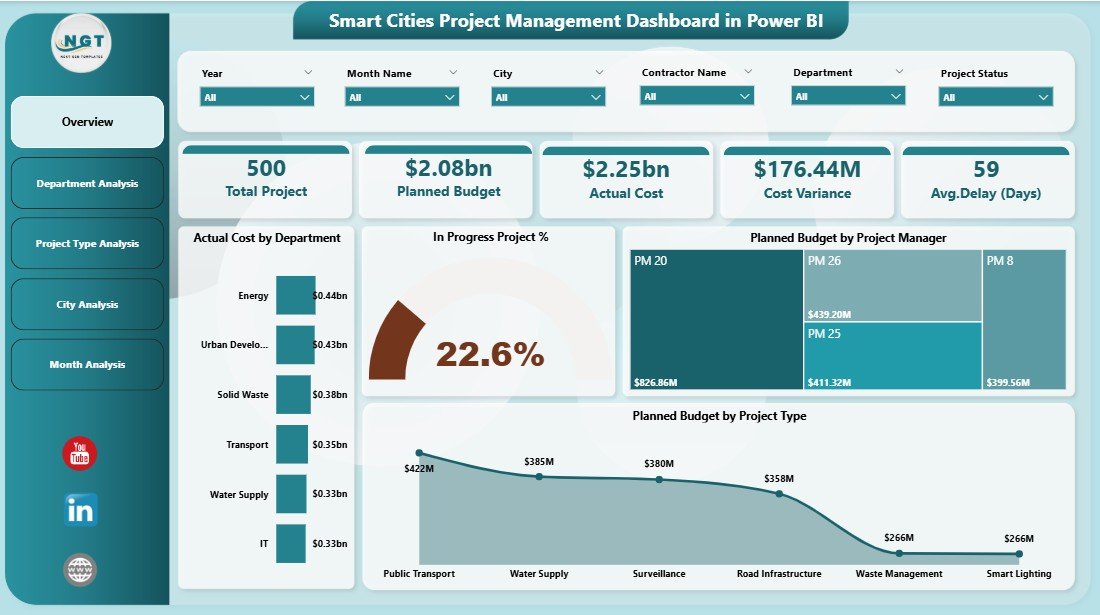
Smart Cities Project Management Dashboard in Power BI

December 27, 2025December 27, 2025 PKComments Off on Smart Cities Project Management Dashboard in Power BI
Smart cities continue to grow in complexity every year. Because governments and urban authorities manage infrastructure projects, digital transformation initiatives, sustainability programs, and public service improvements at the same time,
Read More

Posts pagination

1 2 3 Next
  • Learn Excel (Free Course)
    • 1. Shortcut Keys
    • 2. Fill & Flash Fill
    • 3. Find & Replace
    • 4. Sort & Filter
    • 5. Formulas & Functions
    • 6. Data Validation
    • 7. Conditional Formatting
    • 8. Basic Charts
    • 9. Advanced Charts
    • 10. Pivot Tables
    • 11. Excel Dashboards
    • 12. VBA Course
    • 13. Excel Formulas with AI
  • Templates
  • Tutorials
    • Charts and Visualization
    • VBA
    • Excel Tips and Tricks
    • Excel Dashboards
    • Power Pivot & DAX
  • Power BI
  • Template Store
    • Ready to Use Templates
  • Courses
  • Academy
    • Excel + AI Mastery: 100 Formulas
    • Excel Pivot Tables & Dashboards
  • About Us
  • Contact Us
Copyright © 2023 PK-AnExcelExpert.com - Privacy Policy