New: NextGenTemplates Academy - video courses on Excel formulas with AI and Pivot Tables & dashboards. Early-bird: 20% off with code EARLYBIRD20 - first 20 orders only. See the courses →
  • Learn Excel (Free Course)
    • 1. Shortcut Keys
    • 2. Fill & Flash Fill
    • 3. Find & Replace
    • 4. Sort & Filter
    • 5. Formulas & Functions
    • 6. Data Validation
    • 7. Conditional Formatting
    • 8. Basic Charts
    • 9. Advanced Charts
    • 10. Pivot Tables
    • 11. Excel Dashboards
    • 12. VBA Course
    • 13. Excel Formulas with AI
  • Templates
  • Tutorials
    • Charts and Visualization
    • VBA
    • Excel Tips and Tricks
    • Excel Dashboards
    • Power Pivot & DAX
  • Power BI
  • Template Store
    • Ready to Use Templates
  • Courses
  • Academy
    • Excel + AI Mastery: 100 Formulas
    • Excel Pivot Tables & Dashboards
  • About Us
  • Contact Us

PK: An Excel Expert

Transforming Data into Decisions

Tag: Convenience Store Analytics

Dashboard

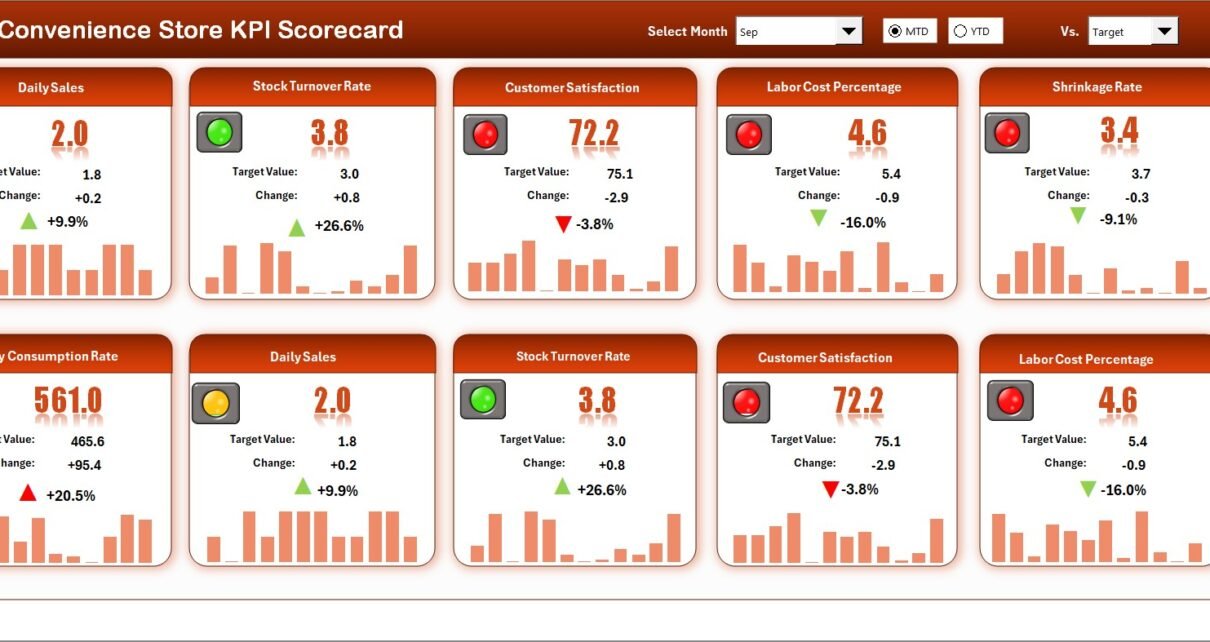
Convenience Store KPI Scorecard in Excel

April 30, 2026April 30, 2026 PKComments Off on Convenience Store KPI Scorecard in Excel
Convenience Store KPI Scorecard in Excel tracks 20+ store performance KPIs across 4 structured worksheets, with MTD and YTD comparisons, trend charts, and color-coded status indicators. This ready-to-use scorecard template
Read More
Dashboard Power BI

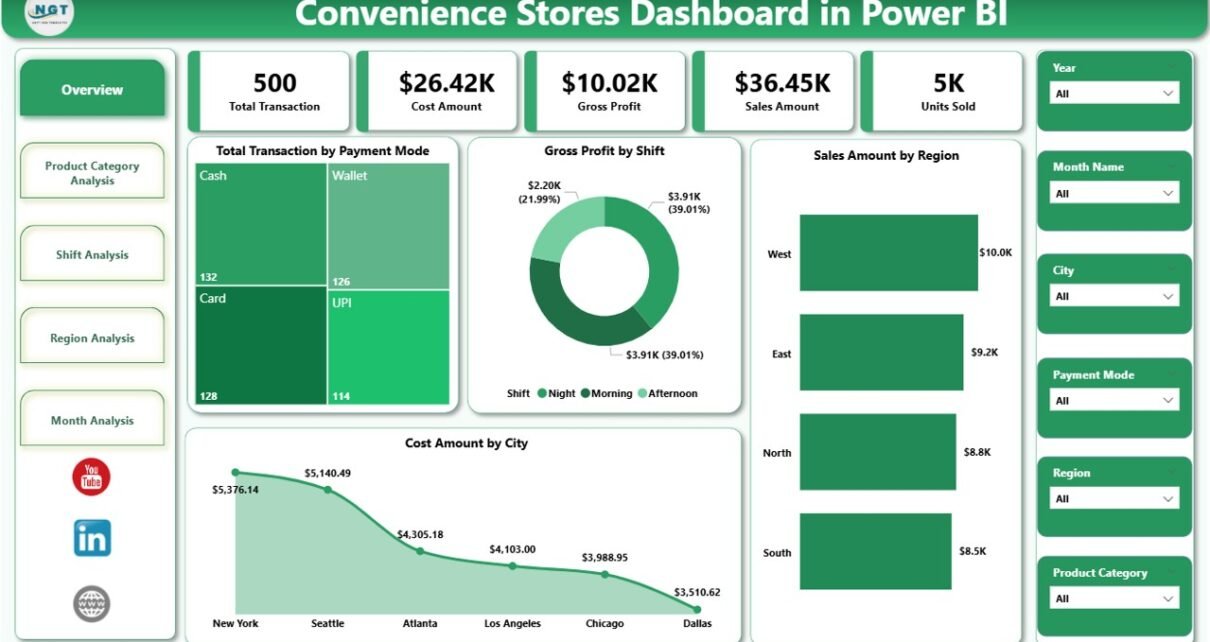
Convenience Stores Dashboard in Power BI

January 28, 2026January 28, 2026 PKComments Off on Convenience Stores Dashboard in Power BI
Running a convenience store looks simple from the outside. However, in reality, it involves managing thousands of transactions, multiple product categories, different shifts, varied payment modes, and regional performance differences—every
Read More
Dashboard

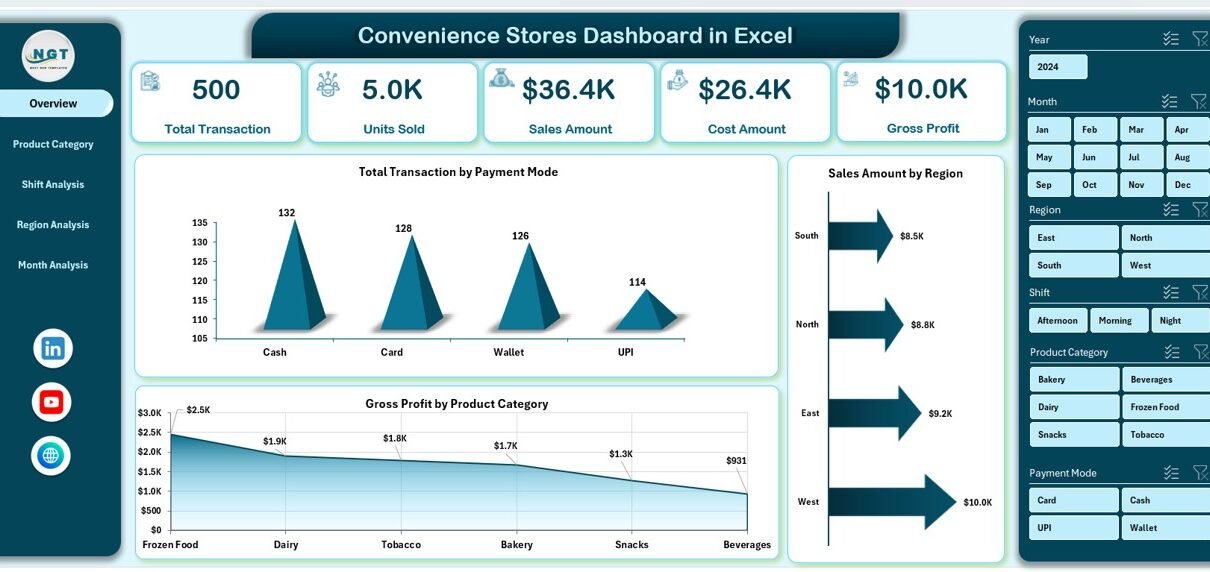
Convenience Stores Dashboard in Excel

January 26, 2026January 26, 2026 PKComments Off on Convenience Stores Dashboard in Excel
Managing a convenience store involves fast decisions, thin margins, and constant monitoring. However, many store owners and managers still depend on scattered Excel files, daily sales registers, and manual reports.
Read More
Power BI

Convenience Stores KPI Dashboard in Power BI

December 9, 2025December 9, 2025 PKComments Off on Convenience Stores KPI Dashboard in Power BI
Running a convenience store business requires fast decisions, accurate insights, and complete visibility into daily operations. However, when sales, margins, inventory, and operational data stay scattered across multiple reports, decision-making
Read More
  • Learn Excel (Free Course)
    • 1. Shortcut Keys
    • 2. Fill & Flash Fill
    • 3. Find & Replace
    • 4. Sort & Filter
    • 5. Formulas & Functions
    • 6. Data Validation
    • 7. Conditional Formatting
    • 8. Basic Charts
    • 9. Advanced Charts
    • 10. Pivot Tables
    • 11. Excel Dashboards
    • 12. VBA Course
    • 13. Excel Formulas with AI
  • Templates
  • Tutorials
    • Charts and Visualization
    • VBA
    • Excel Tips and Tricks
    • Excel Dashboards
    • Power Pivot & DAX
  • Power BI
  • Template Store
    • Ready to Use Templates
  • Courses
  • Academy
    • Excel + AI Mastery: 100 Formulas
    • Excel Pivot Tables & Dashboards
  • About Us
  • Contact Us
Copyright © 2023 PK-AnExcelExpert.com - Privacy Policy