New: NextGenTemplates Academy - video courses on Excel formulas with AI and Pivot Tables & dashboards. Early-bird: 20% off with code EARLYBIRD20 - first 20 orders only. See the courses →
  • Learn Excel (Free Course)
    • 1. Shortcut Keys
    • 2. Fill & Flash Fill
    • 3. Find & Replace
    • 4. Sort & Filter
    • 5. Formulas & Functions
    • 6. Data Validation
    • 7. Conditional Formatting
    • 8. Basic Charts
    • 9. Advanced Charts
    • 10. Pivot Tables
    • 11. Excel Dashboards
    • 12. VBA Course
    • 13. Excel Formulas with AI
  • Templates
  • Tutorials
    • Charts and Visualization
    • VBA
    • Excel Tips and Tricks
    • Excel Dashboards
    • Power Pivot & DAX
  • Power BI
  • Template Store
    • Ready to Use Templates
  • Courses
  • Academy
    • Excel + AI Mastery: 100 Formulas
    • Excel Pivot Tables & Dashboards
  • About Us
  • Contact Us

PK: An Excel Expert

Transforming Data into Decisions

Tag: Data analysis tools

Templates

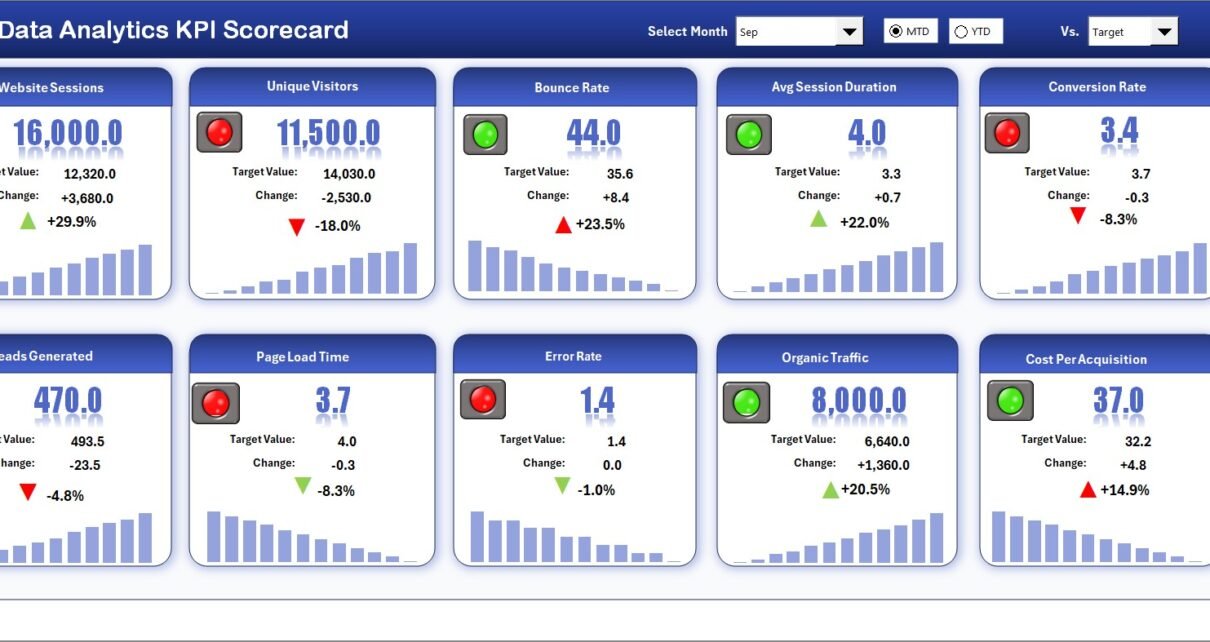
Data Analytics KPI Scorecard in Excel

February 28, 2026February 28, 2026 PKComments Off on Data Analytics KPI Scorecard in Excel
In today’s data-driven business environment, organizations rely heavily on data analytics to make smarter decisions, improve operational efficiency, and gain competitive advantages. Companies collect massive volumes of data every day.
Read More
Dashboard

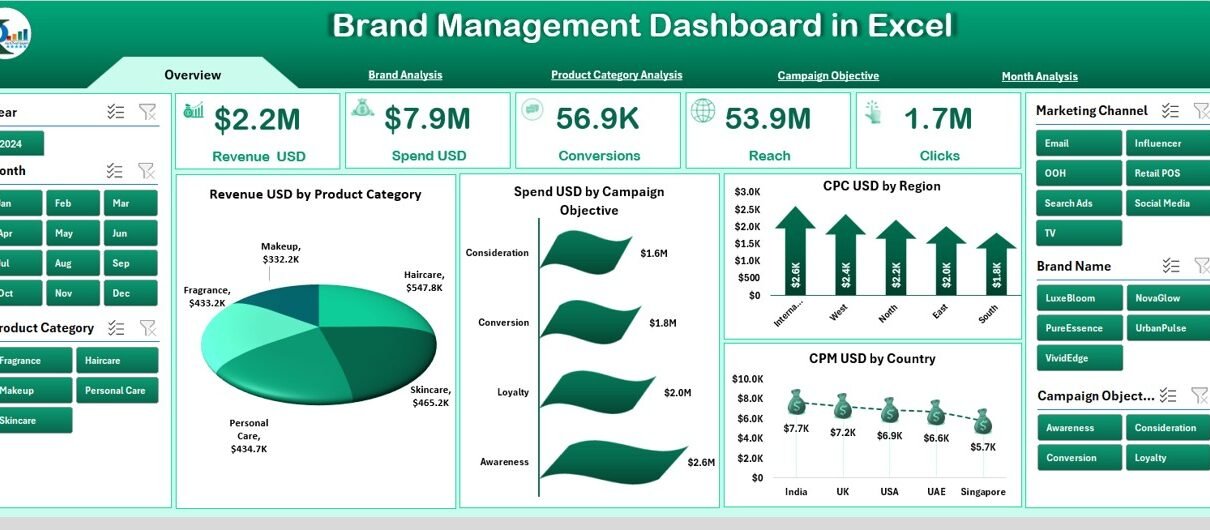
Brand Management Dashboard in Excel

November 29, 2025November 29, 2025 PKComments Off on Brand Management Dashboard in Excel
Managing a brand becomes easier when you track the right data at the right time. Companies run ads, launch campaigns, promote products, and build brand awareness every day. However, teams
Read More
Dashboard

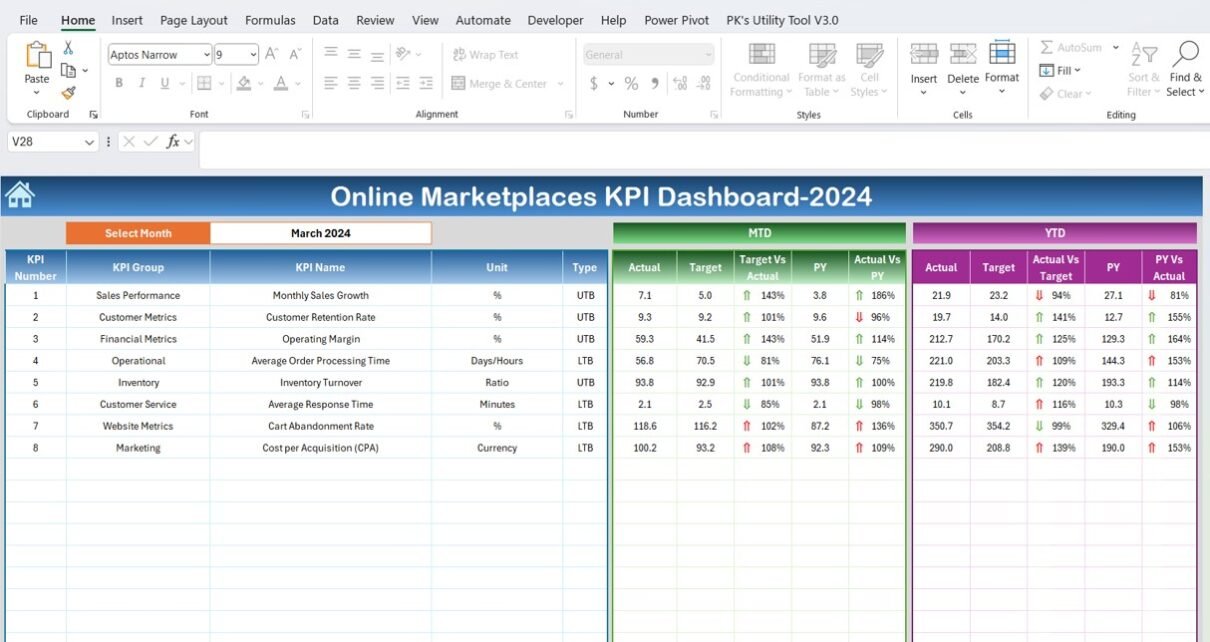
Online Marketplaces KPI Dashboard in Excel

December 16, 2024March 8, 2025 PKComments Off on Online Marketplaces KPI Dashboard in Excel
In today's fast-paced digital marketplace, having an edge means leveraging every tool at your disposal, especially when it comes to data. The Online Marketplaces KPI Dashboard in Excel is precisely
Read More
Power BI

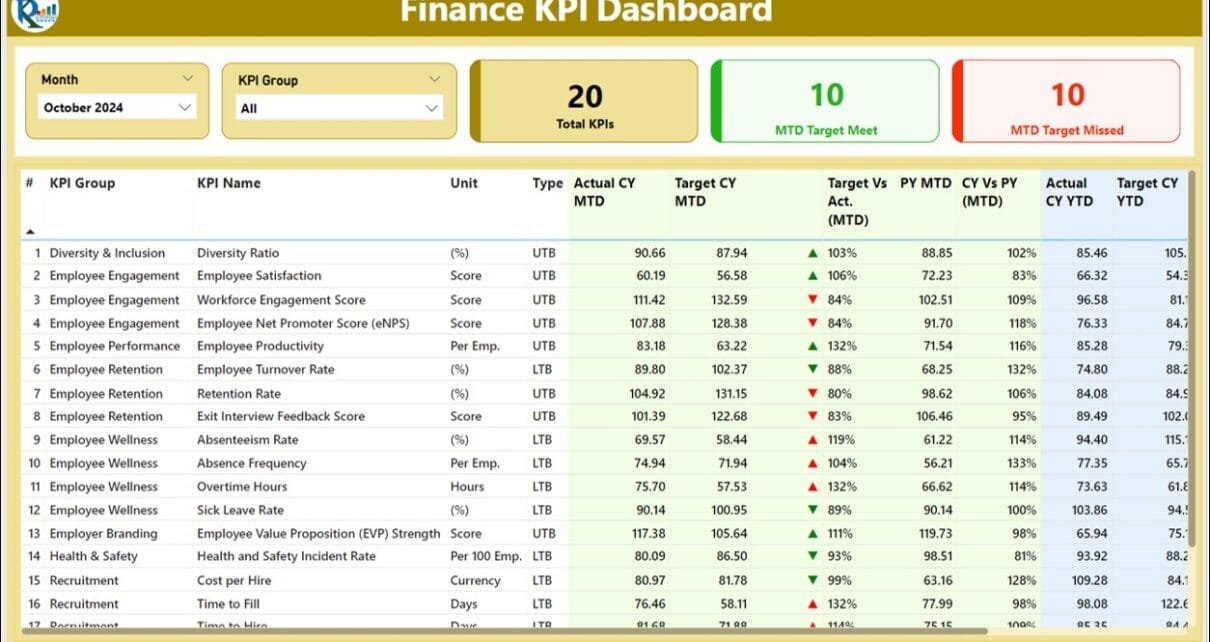
Finance KPI Dashboard in Power BI

December 3, 2024March 2, 2025 PKComments Off on Finance KPI Dashboard in Power BI
In today's data-driven business landscape, tracking financial performance effectively is crucial. A Finance KPI Dashboard in Power BI helps businesses monitor key performance indicators (KPIs) in real time, providing actionable
Read More
  • Learn Excel (Free Course)
    • 1. Shortcut Keys
    • 2. Fill & Flash Fill
    • 3. Find & Replace
    • 4. Sort & Filter
    • 5. Formulas & Functions
    • 6. Data Validation
    • 7. Conditional Formatting
    • 8. Basic Charts
    • 9. Advanced Charts
    • 10. Pivot Tables
    • 11. Excel Dashboards
    • 12. VBA Course
    • 13. Excel Formulas with AI
  • Templates
  • Tutorials
    • Charts and Visualization
    • VBA
    • Excel Tips and Tricks
    • Excel Dashboards
    • Power Pivot & DAX
  • Power BI
  • Template Store
    • Ready to Use Templates
  • Courses
  • Academy
    • Excel + AI Mastery: 100 Formulas
    • Excel Pivot Tables & Dashboards
  • About Us
  • Contact Us
Copyright © 2023 PK-AnExcelExpert.com - Privacy Policy