New: NextGenTemplates Academy - video courses on Excel formulas with AI and Pivot Tables & dashboards. Early-bird: 20% off with code EARLYBIRD20 - first 20 orders only. See the courses →
  • Learn Excel (Free Course)
    • 1. Shortcut Keys
    • 2. Fill & Flash Fill
    • 3. Find & Replace
    • 4. Sort & Filter
    • 5. Formulas & Functions
    • 6. Data Validation
    • 7. Conditional Formatting
    • 8. Basic Charts
    • 9. Advanced Charts
    • 10. Pivot Tables
    • 11. Excel Dashboards
    • 12. VBA Course
    • 13. Excel Formulas with AI
  • Templates
  • Tutorials
    • Charts and Visualization
    • VBA
    • Excel Tips and Tricks
    • Excel Dashboards
    • Power Pivot & DAX
  • Power BI
  • Template Store
    • Ready to Use Templates
  • Courses
  • Academy
    • Excel + AI Mastery: 100 Formulas
    • Excel Pivot Tables & Dashboards
  • About Us
  • Contact Us

PK: An Excel Expert

Transforming Data into Decisions

Tag: delivery performance

Dashboard

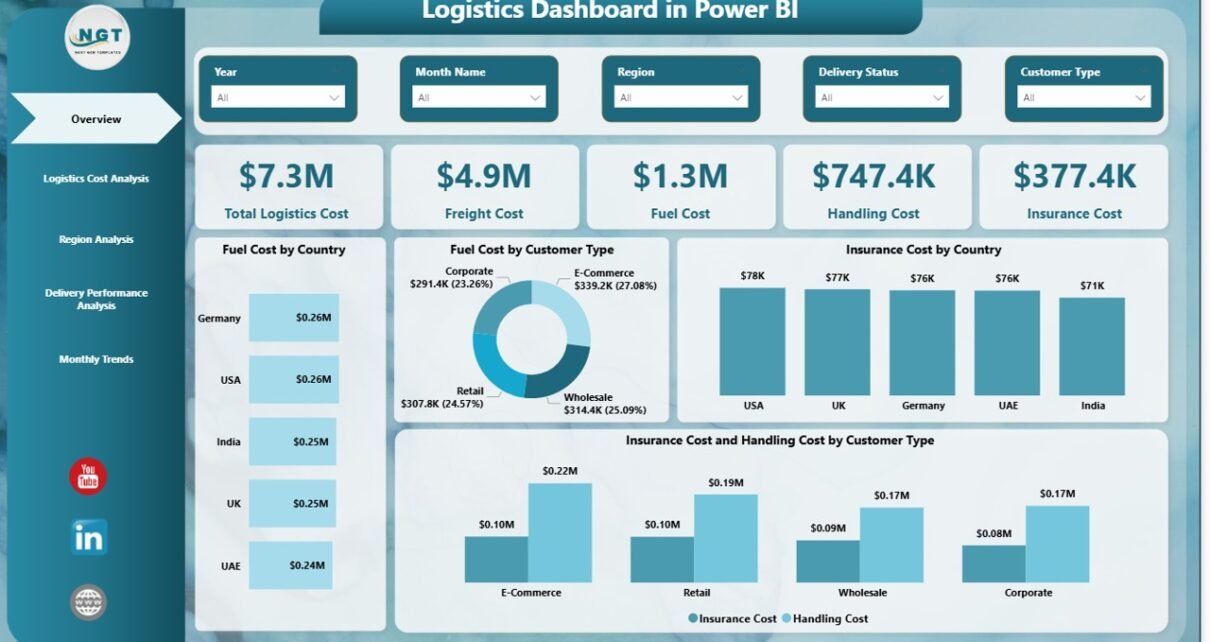
Logistics Dashboard in Power BI

February 25, 2026February 25, 2026 PKComments Off on Logistics Dashboard in Power BI
Modern supply chains generate massive volumes of operational data every single day. Companies manage shipments, warehouses, transportation costs, delivery timelines, fuel expenses, and insurance charges across multiple regions and customers.
Read More
Dashboard

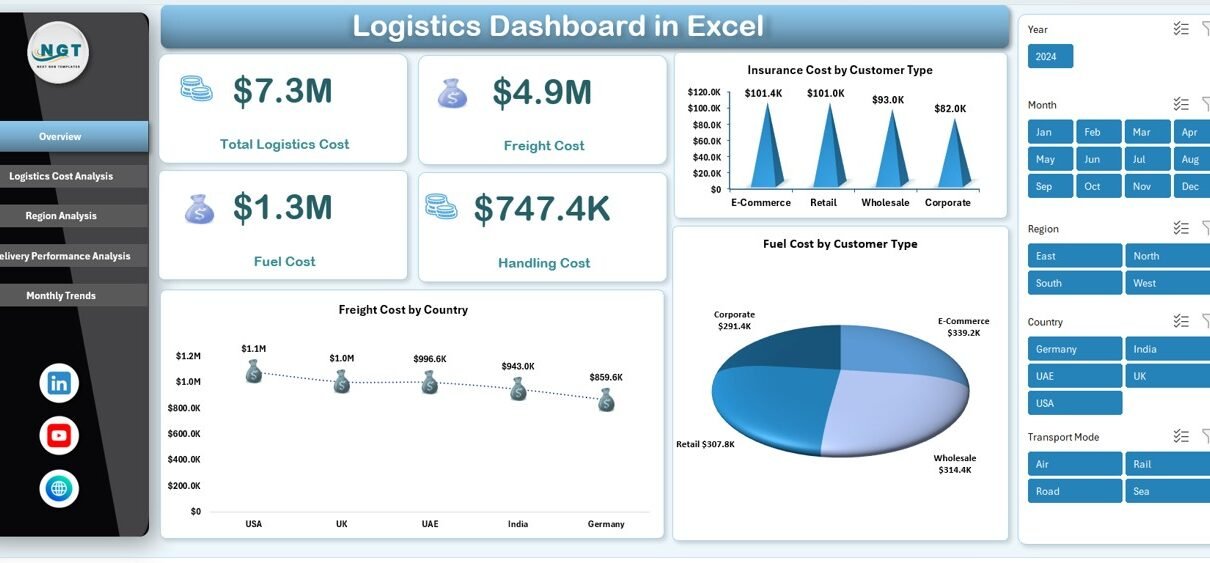
Logistics Dashboard in Excel

February 23, 2026February 23, 2026 PKComments Off on Logistics Dashboard in Excel
Managing logistics operations has become more complex than ever. Companies handle multiple shipments, warehouses, carriers, and transportation costs every day. Therefore, businesses need a smart way to monitor logistics performance
Read More
Dashboard Power BI

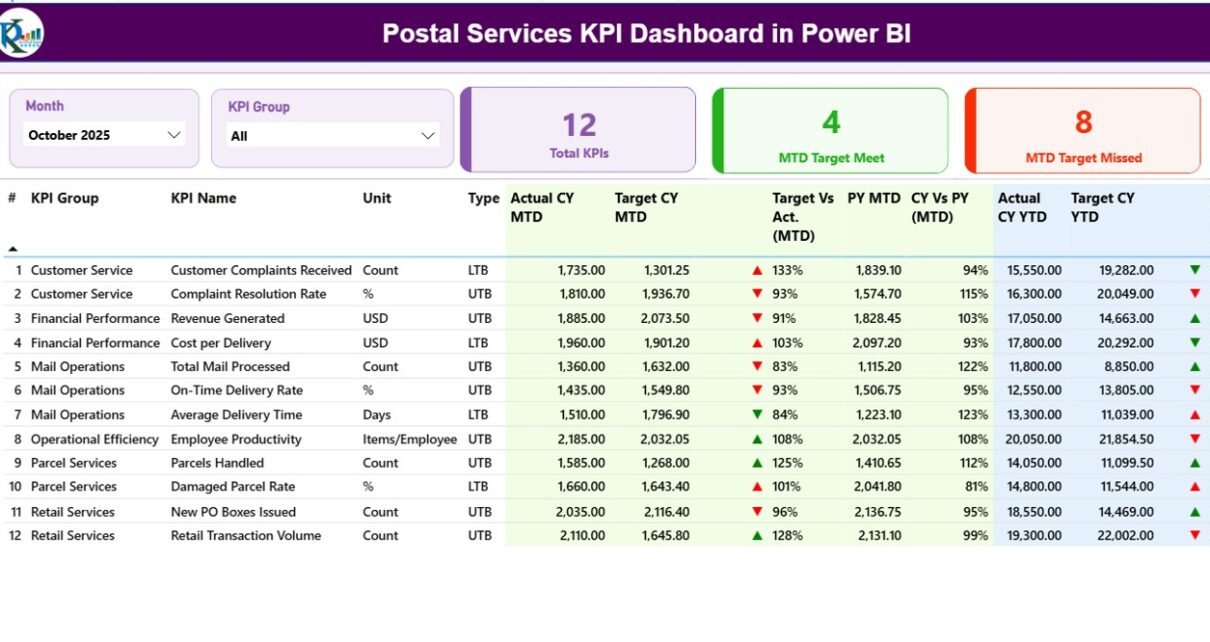
Postal Services KPI Dashboard in Power BI

February 13, 2026February 13, 2026 PKComments Off on Postal Services KPI Dashboard in Power BI
In today’s fast-moving logistics environment, postal organizations must track performance daily. Customers expect fast delivery. Managers demand accuracy. Regulators require compliance. Therefore, postal departments need clear visibility into their KPIs.
Read More
Templates

Last-Mile Delivery KPI Dashboard in Power BI

November 5, 2025November 5, 2025 PKComments Off on Last-Mile Delivery KPI Dashboard in Power BI
In today’s fast-paced logistics and e-commerce environment, last-mile delivery defines customer satisfaction. It’s the final and most crucial step — when a parcel leaves the local hub and reaches the
Read More
Templates

Transportation Report in Excel

October 15, 2025October 15, 2025 PKComments Off on Transportation Report in Excel
In today’s fast-moving business world, transportation and logistics are the backbone of every successful supply chain. Whether it’s delivering goods to customers, managing fleets, or monitoring fuel efficiency, transportation data
Read More
Templates

Last-Mile Delivery KPI Dashboard in Excel

October 9, 2025October 9, 2025 PKComments Off on Last-Mile Delivery KPI Dashboard in Excel
In today’s fast-moving e-commerce world, customers expect quick, transparent, and error-free deliveries. The last-mile delivery stage — where a product travels from the distribution hub to the customer’s doorstep —
Read More
Power BI

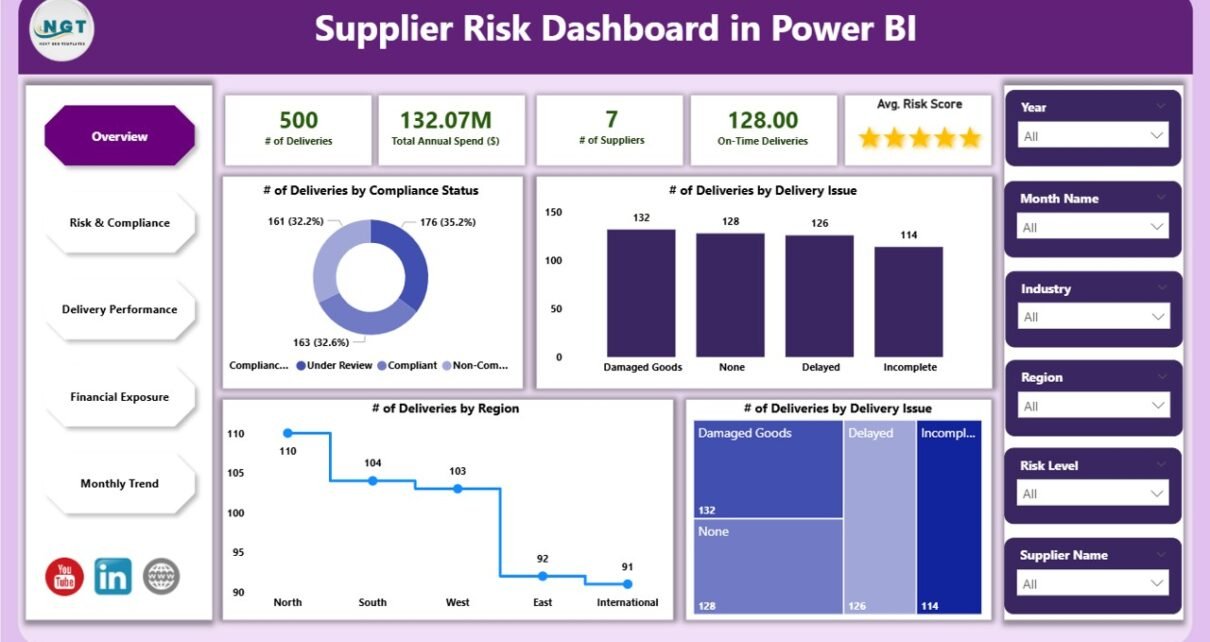
Supplier Risk Dashboard in Power BI

September 29, 2025September 29, 2025 PKComments Off on Supplier Risk Dashboard in Power BI
Supplier performance and risk management are critical for maintaining smooth operations and avoiding financial or operational disruptions. The Supplier Risk Dashboard in Power BI is a ready-to-use solution that helps
Read More
Power Pivot

Food Delivery KPI Dashboard in Excel

December 26, 2024April 10, 2025 PKComments Off on Food Delivery KPI Dashboard in Excel
In the fast-paced world of food delivery services, ensuring efficient operations and customer satisfaction is essential. To keep up with the competition and meet customer expectations, businesses need accurate, real-time
Read More
  • Learn Excel (Free Course)
    • 1. Shortcut Keys
    • 2. Fill & Flash Fill
    • 3. Find & Replace
    • 4. Sort & Filter
    • 5. Formulas & Functions
    • 6. Data Validation
    • 7. Conditional Formatting
    • 8. Basic Charts
    • 9. Advanced Charts
    • 10. Pivot Tables
    • 11. Excel Dashboards
    • 12. VBA Course
    • 13. Excel Formulas with AI
  • Templates
  • Tutorials
    • Charts and Visualization
    • VBA
    • Excel Tips and Tricks
    • Excel Dashboards
    • Power Pivot & DAX
  • Power BI
  • Template Store
    • Ready to Use Templates
  • Courses
  • Academy
    • Excel + AI Mastery: 100 Formulas
    • Excel Pivot Tables & Dashboards
  • About Us
  • Contact Us
Copyright © 2023 PK-AnExcelExpert.com - Privacy Policy