New: NextGenTemplates Academy - video courses on Excel formulas with AI and Pivot Tables & dashboards. Early-bird: 20% off with code EARLYBIRD20 - first 20 orders only. See the courses →
  • Learn Excel (Free Course)
    • 1. Shortcut Keys
    • 2. Fill & Flash Fill
    • 3. Find & Replace
    • 4. Sort & Filter
    • 5. Formulas & Functions
    • 6. Data Validation
    • 7. Conditional Formatting
    • 8. Basic Charts
    • 9. Advanced Charts
    • 10. Pivot Tables
    • 11. Excel Dashboards
    • 12. VBA Course
    • 13. Excel Formulas with AI
  • Templates
  • Tutorials
    • Charts and Visualization
    • VBA
    • Excel Tips and Tricks
    • Excel Dashboards
    • Power Pivot & DAX
  • Power BI
  • Template Store
    • Ready to Use Templates
  • Courses
  • Academy
    • Excel + AI Mastery: 100 Formulas
    • Excel Pivot Tables & Dashboards
  • About Us
  • Contact Us

PK: An Excel Expert

Transforming Data into Decisions

Tag: Energy Dashboard

Dashboard

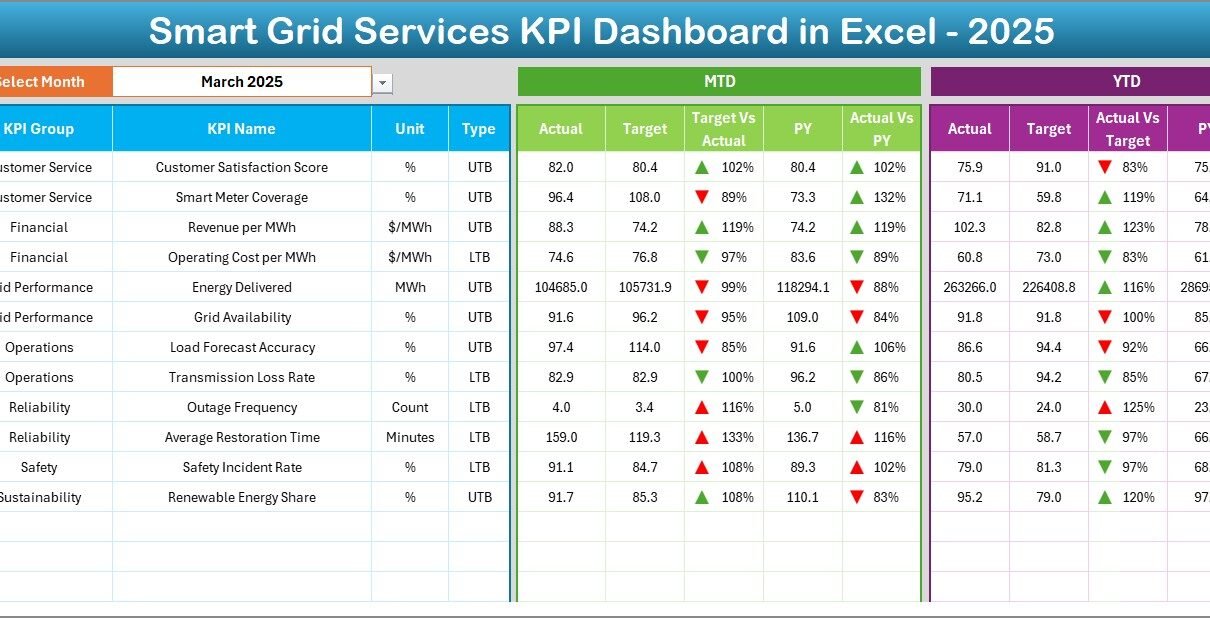
Smart Grid Services KPI Dashboard in Excel

March 1, 2026March 1, 2026 PKComments Off on Smart Grid Services KPI Dashboard in Excel
Smart grid services keep modern power systems reliable, efficient, and ready for the future. However, many utility teams still track performance using scattered files, email updates, and different tools. As
Read More
Dashboard Power BI

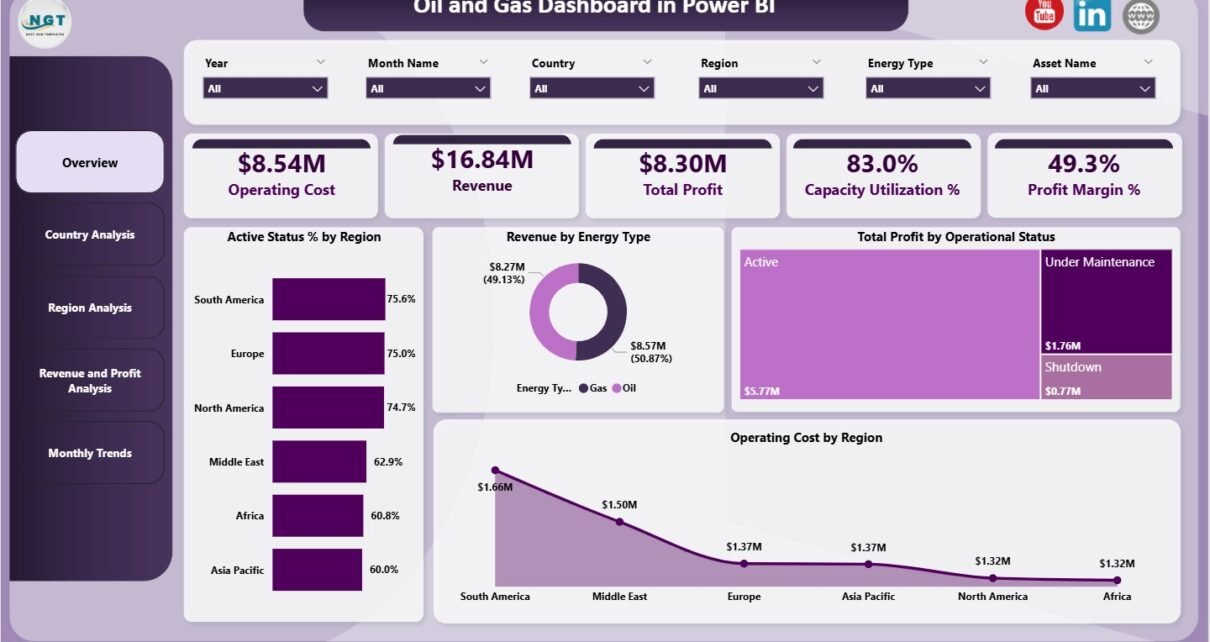
Oil and Gas Dashboard in Power BI

January 16, 2026January 16, 2026 PKComments Off on Oil and Gas Dashboard in Power BI
The oil and gas industry runs on data, scale, and precision. Every day, companies track production, revenue, operating cost, capacity utilization, and profit margins across regions and countries. However, when
Read More
Templates

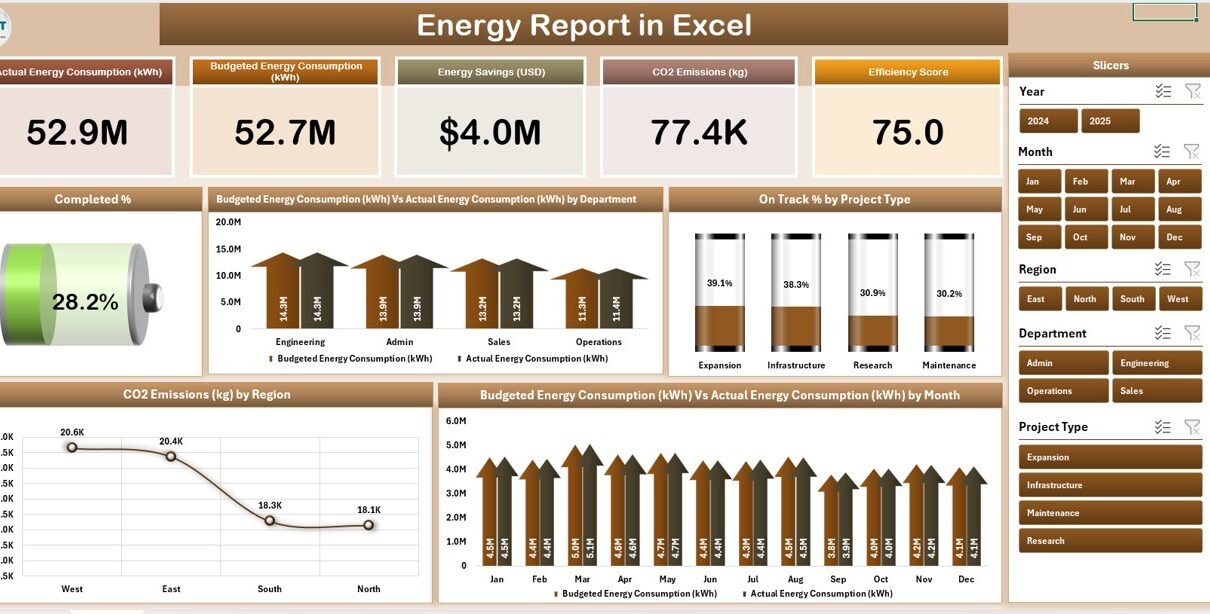
Energy Report in Excel

October 16, 2025October 16, 2025 PKComments Off on Energy Report in Excel
In today’s data-driven world, energy efficiency is no longer optional — it’s essential. Whether you manage an industrial facility, a commercial complex, or an organization striving to reduce energy costs,
Read More
Dashboard Power BI

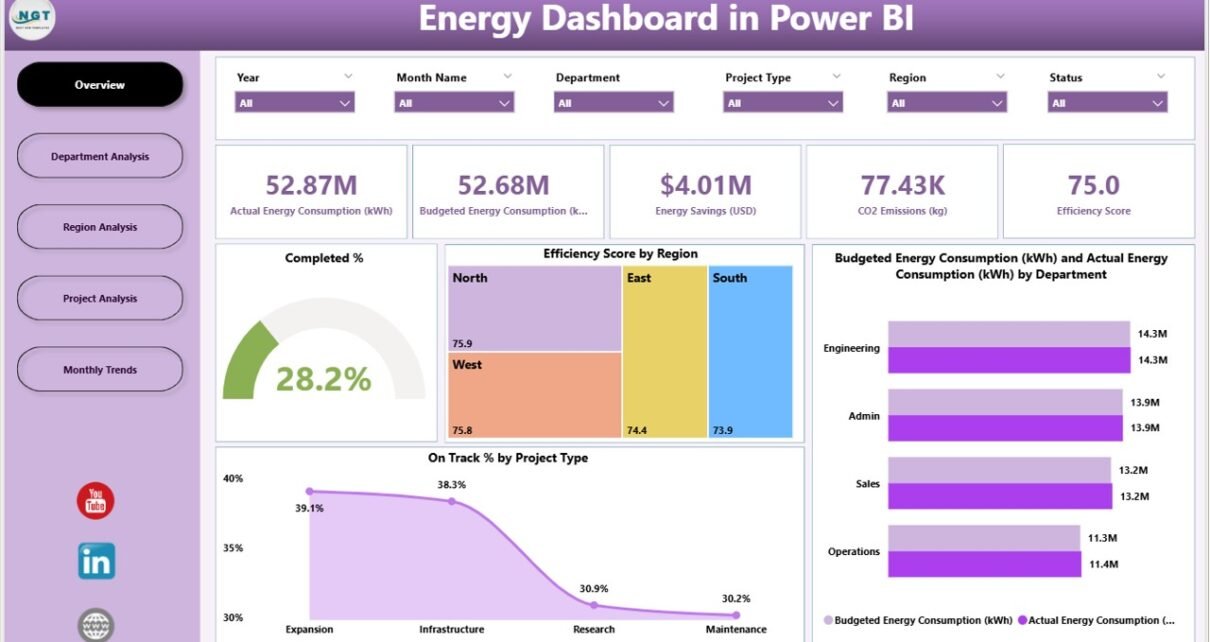
Energy Dashboard in Power BI

October 8, 2025October 8, 2025 PKComments Off on Energy Dashboard in Power BI
In today’s sustainability-driven world, energy efficiency is more than just a corporate buzzword — it’s a necessity. Organizations across industries aim to reduce costs, improve resource utilization, and minimize environmental
Read More
Dashboard

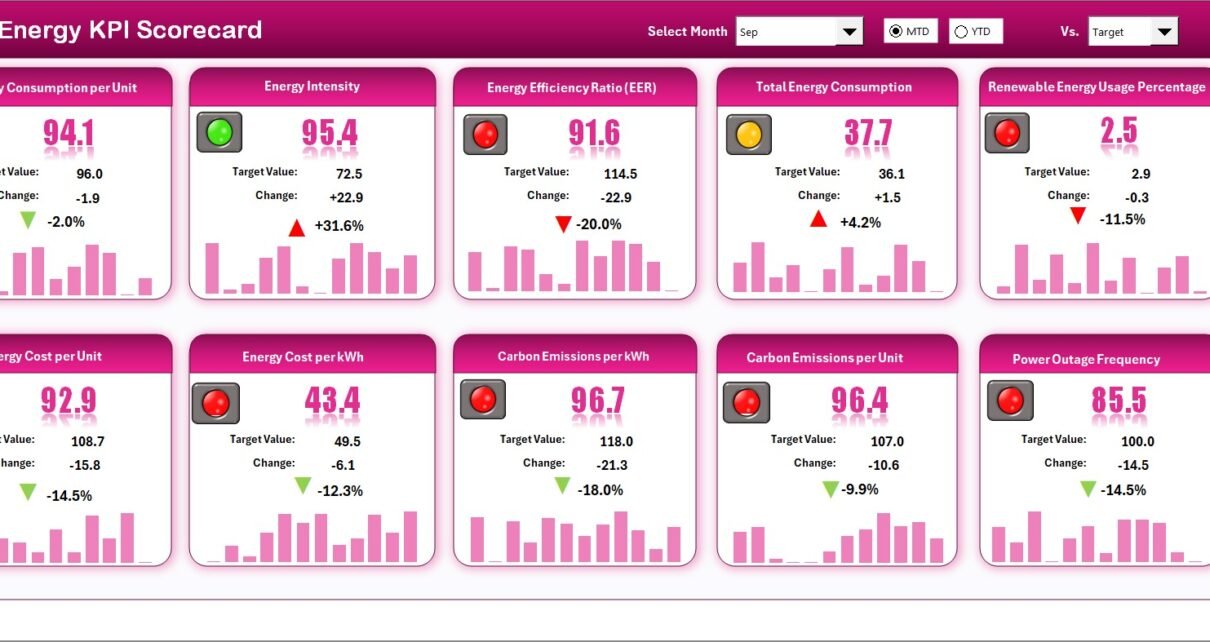
Energy KPI Scorecard in Excel

October 7, 2025October 7, 2025 PKComments Off on Energy KPI Scorecard in Excel
In today’s data-driven world, energy management plays a crucial role in sustainability, operational efficiency, and cost control. Businesses across manufacturing, utilities, real estate, and service sectors are under increasing pressure
Read More
Dashboard

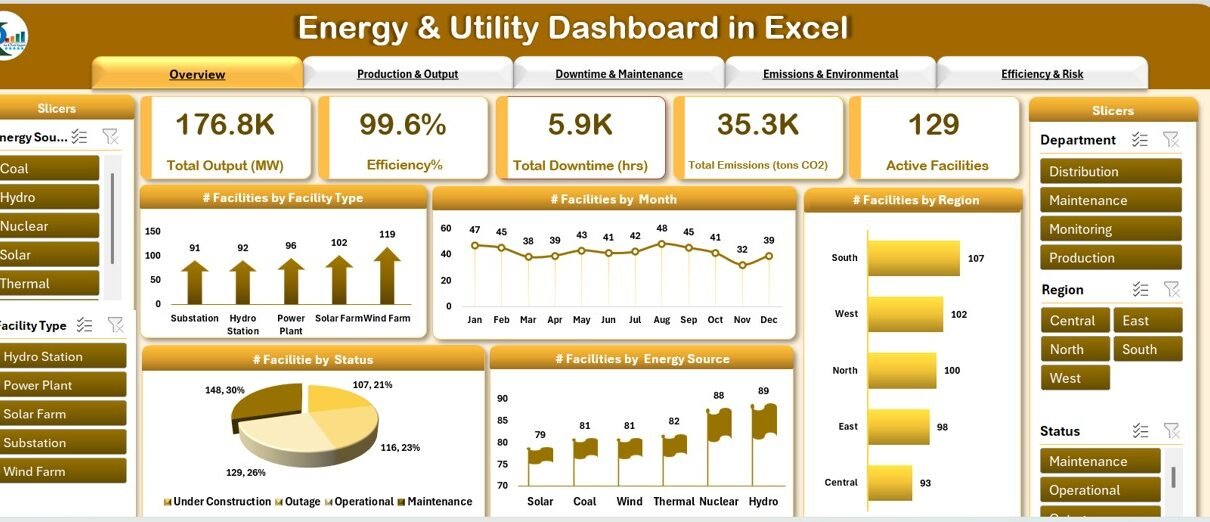
Energy & Utility Dashboard in Excel

May 23, 2025May 23, 2025 PKComments Off on Energy & Utility Dashboard in Excel
In today's fast-paced energy and utility sectors, managing operational data efficiently can significantly impact the overall performance of facilities. An Energy & Utility Dashboard in Excel is a powerful tool
Read More
  • Learn Excel (Free Course)
    • 1. Shortcut Keys
    • 2. Fill & Flash Fill
    • 3. Find & Replace
    • 4. Sort & Filter
    • 5. Formulas & Functions
    • 6. Data Validation
    • 7. Conditional Formatting
    • 8. Basic Charts
    • 9. Advanced Charts
    • 10. Pivot Tables
    • 11. Excel Dashboards
    • 12. VBA Course
    • 13. Excel Formulas with AI
  • Templates
  • Tutorials
    • Charts and Visualization
    • VBA
    • Excel Tips and Tricks
    • Excel Dashboards
    • Power Pivot & DAX
  • Power BI
  • Template Store
    • Ready to Use Templates
  • Courses
  • Academy
    • Excel + AI Mastery: 100 Formulas
    • Excel Pivot Tables & Dashboards
  • About Us
  • Contact Us
Copyright © 2023 PK-AnExcelExpert.com - Privacy Policy