New: NextGenTemplates Academy - video courses on Excel formulas with AI and Pivot Tables & dashboards. Early-bird: 20% off with code EARLYBIRD20 - first 20 orders only. See the courses →
  • Learn Excel (Free Course)
    • 1. Shortcut Keys
    • 2. Fill & Flash Fill
    • 3. Find & Replace
    • 4. Sort & Filter
    • 5. Formulas & Functions
    • 6. Data Validation
    • 7. Conditional Formatting
    • 8. Basic Charts
    • 9. Advanced Charts
    • 10. Pivot Tables
    • 11. Excel Dashboards
    • 12. VBA Course
    • 13. Excel Formulas with AI
  • Templates
  • Tutorials
    • Charts and Visualization
    • VBA
    • Excel Tips and Tricks
    • Excel Dashboards
    • Power Pivot & DAX
  • Power BI
  • Template Store
    • Ready to Use Templates
  • Courses
  • Academy
    • Excel + AI Mastery: 100 Formulas
    • Excel Pivot Tables & Dashboards
  • About Us
  • Contact Us

PK: An Excel Expert

Transforming Data into Decisions

Tag: Energy Sector Analytics

Dashboard

Electricity Contract Dashboard in Excel

March 9, 2026March 9, 2026 PKComments Off on Electricity Contract Dashboard in Excel
Electricity contracts play a critical role in the energy industry. Utilities, energy providers, and power trading companies manage hundreds or even thousands of contracts with businesses, industries, and public sector
Read More
Dashboard

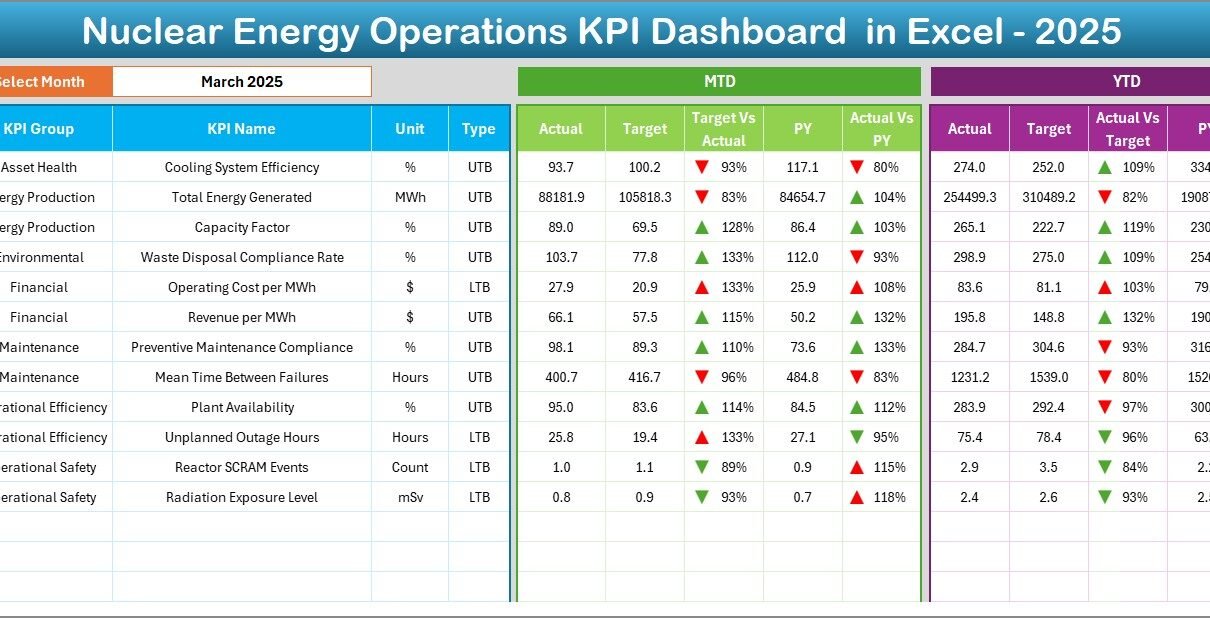
Nuclear Energy Operations KPI Dashboard in Excel

March 3, 2026October 10, 2026 PKComments Off on Nuclear Energy Operations KPI Dashboard in Excel
Managing nuclear energy operations demands accuracy, safety, and continuous performance monitoring. However, many power plants still rely on scattered spreadsheets and manual tracking. As a result, decision-makers struggle to monitor
Read More
Power Pivot

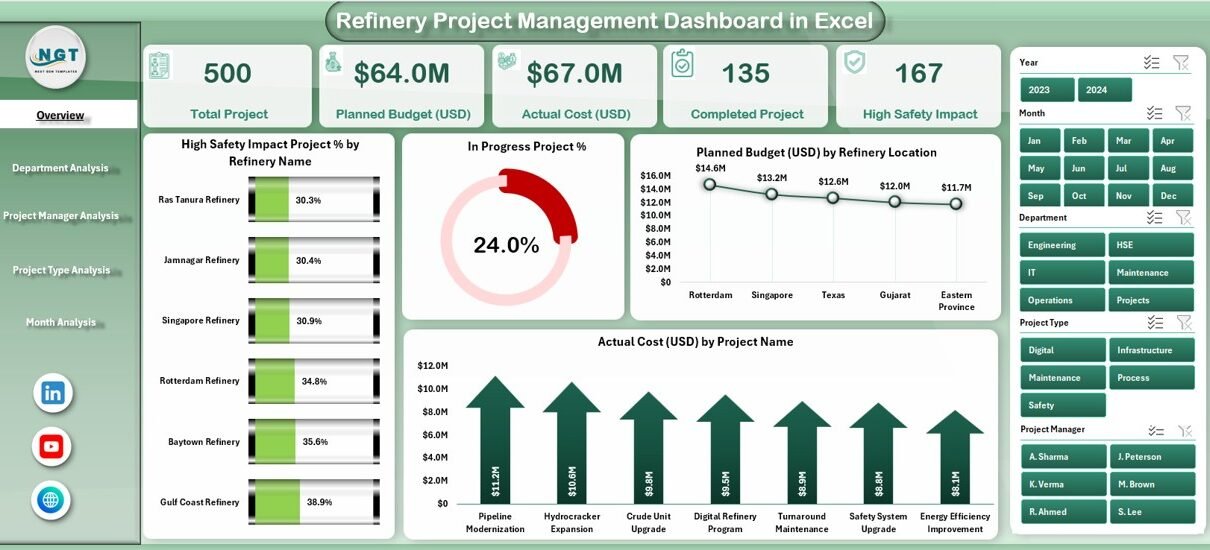
Refinery Project Management Dashboard in Excel

December 25, 2025December 25, 2025 PKComments Off on Refinery Project Management Dashboard in Excel
Managing refinery projects requires precision, speed, and clear visibility. Refinery projects often involve high capital investment, safety risks, multiple departments, and strict timelines. Therefore, project managers must track performance accurately
Read More
Dashboard

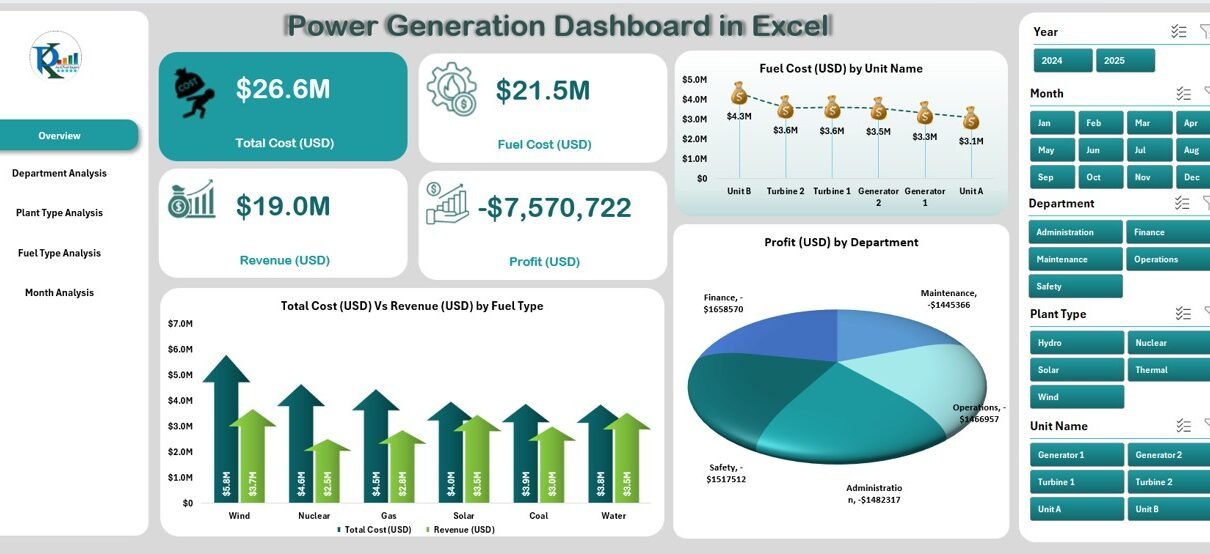
Power Generation Dashboard in Excel

October 30, 2025October 30, 2025 PKComments Off on Power Generation Dashboard in Excel
In today’s energy-driven economy, power generation companies handle complex data daily. From fuel costs and plant types to energy output and profitability, every metric plays a role in operational efficiency
Read More
  • Learn Excel (Free Course)
    • 1. Shortcut Keys
    • 2. Fill & Flash Fill
    • 3. Find & Replace
    • 4. Sort & Filter
    • 5. Formulas & Functions
    • 6. Data Validation
    • 7. Conditional Formatting
    • 8. Basic Charts
    • 9. Advanced Charts
    • 10. Pivot Tables
    • 11. Excel Dashboards
    • 12. VBA Course
    • 13. Excel Formulas with AI
  • Templates
  • Tutorials
    • Charts and Visualization
    • VBA
    • Excel Tips and Tricks
    • Excel Dashboards
    • Power Pivot & DAX
  • Power BI
  • Template Store
    • Ready to Use Templates
  • Courses
  • Academy
    • Excel + AI Mastery: 100 Formulas
    • Excel Pivot Tables & Dashboards
  • About Us
  • Contact Us
Copyright © 2023 PK-AnExcelExpert.com - Privacy Policy