New: NextGenTemplates Academy - video courses on Excel formulas with AI and Pivot Tables & dashboards. Early-bird: 20% off with code EARLYBIRD20 - first 20 orders only. See the courses →
  • Learn Excel (Free Course)
    • 1. Shortcut Keys
    • 2. Fill & Flash Fill
    • 3. Find & Replace
    • 4. Sort & Filter
    • 5. Formulas & Functions
    • 6. Data Validation
    • 7. Conditional Formatting
    • 8. Basic Charts
    • 9. Advanced Charts
    • 10. Pivot Tables
    • 11. Excel Dashboards
    • 12. VBA Course
    • 13. Excel Formulas with AI
  • Templates
  • Tutorials
    • Charts and Visualization
    • VBA
    • Excel Tips and Tricks
    • Excel Dashboards
    • Power Pivot & DAX
  • Power BI
  • Template Store
    • Ready to Use Templates
  • Courses
  • Academy
    • Excel + AI Mastery: 100 Formulas
    • Excel Pivot Tables & Dashboards
  • About Us
  • Contact Us

PK: An Excel Expert

Transforming Data into Decisions

Tag: Excel analytics

Dashboard

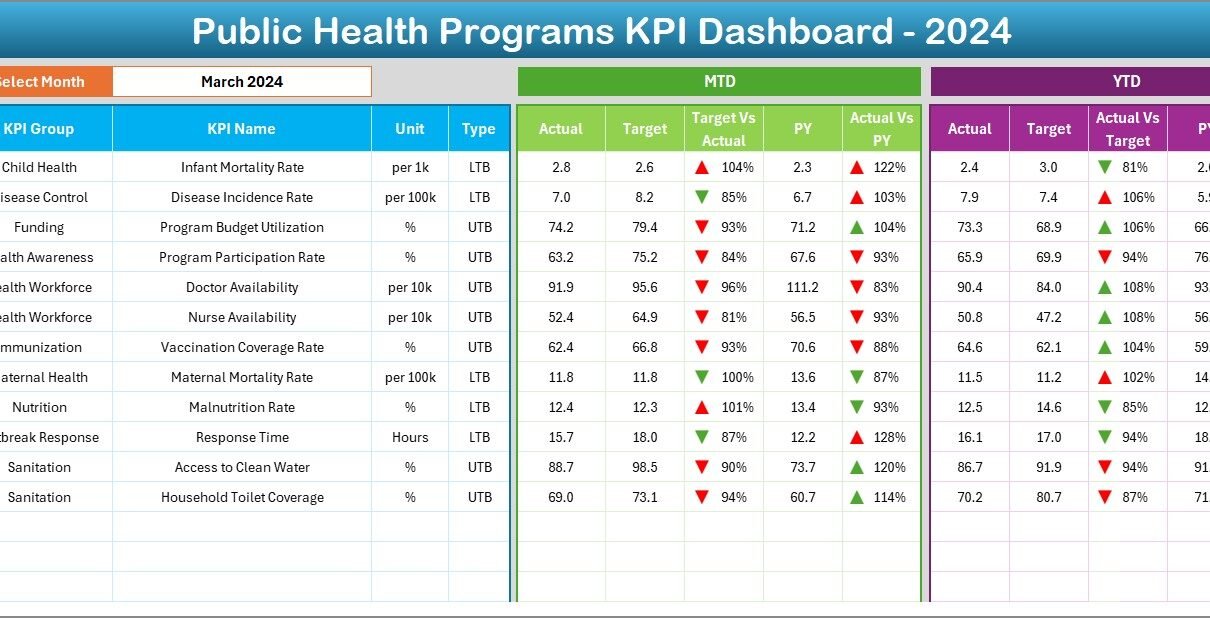
Public Health Programs KPI Dashboard in Excel

November 27, 2025November 27, 2025 PKComments Off on Public Health Programs KPI Dashboard in Excel
Public health programs are critical for improving population health, reducing disease burden, and ensuring access to quality healthcare services. Monitoring the effectiveness of these programs requires accurate data and clear
Read More
Templates

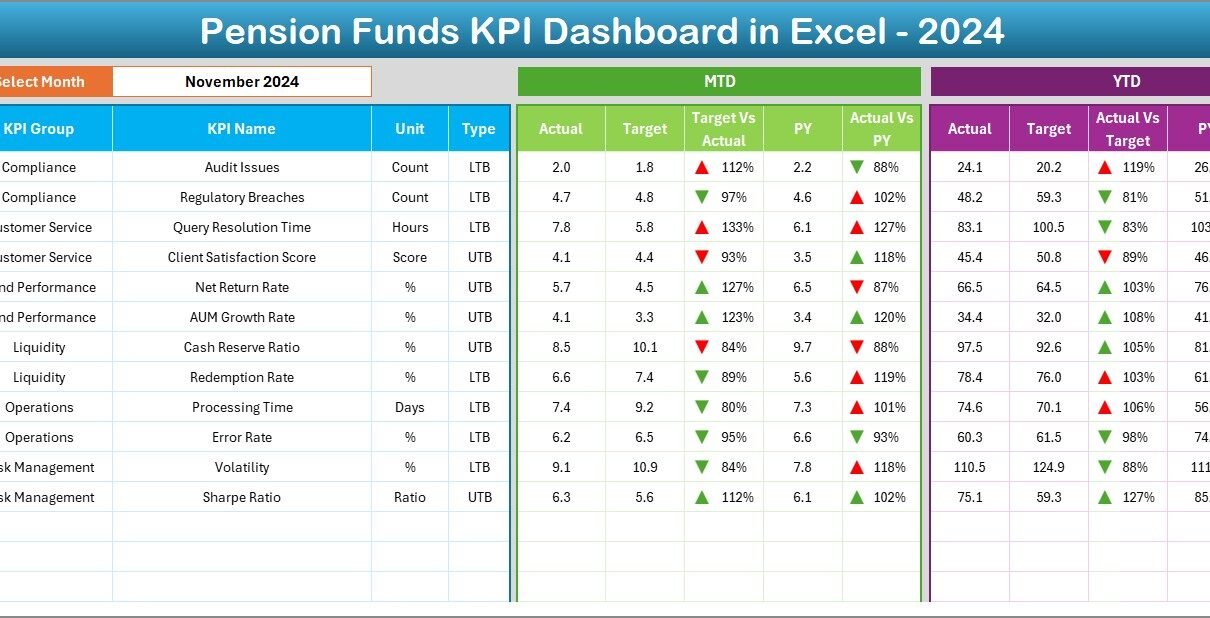
Pension Funds KPI Dashboard in Excel

November 25, 2025November 25, 2025 PKComments Off on Pension Funds KPI Dashboard in Excel
Managing pension funds always requires accuracy, clarity, and timely insights. As pension fund managers deal with investments, liabilities, contributions, risk assessment, and compliance, they often need a single place to
Read More
Dashboard

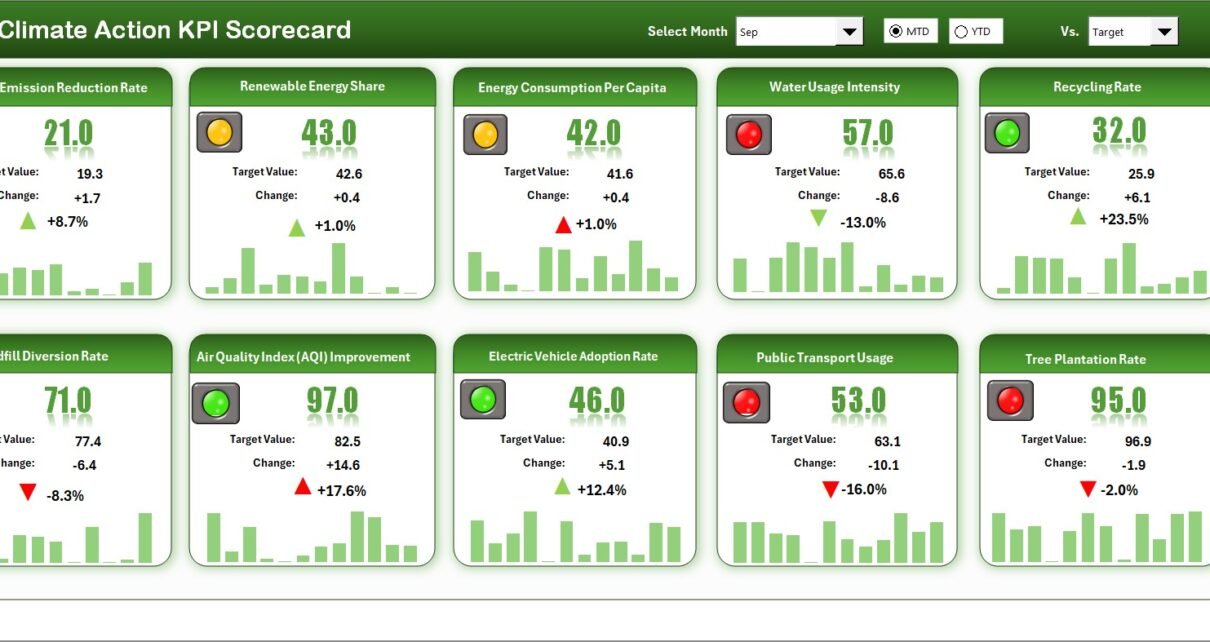
Climate Action KPI Scorecard in Excel

October 27, 2025October 27, 2025 PKComments Off on Climate Action KPI Scorecard in Excel
Climate change is one of the most critical global challenges of our time. To combat its effects effectively, organizations, governments, and businesses must not only commit to sustainability goals but
Read More
Dashboard

Comic Books and Publishing KPI Dashboard in Excel

October 27, 2025October 27, 2025 PKComments Off on Comic Books and Publishing KPI Dashboard in Excel
In today’s publishing world, success depends not only on creativity but also on data-driven insights. The comic book and publishing industry thrives on audience engagement, production efficiency, and sales performance
Read More
Dashboard

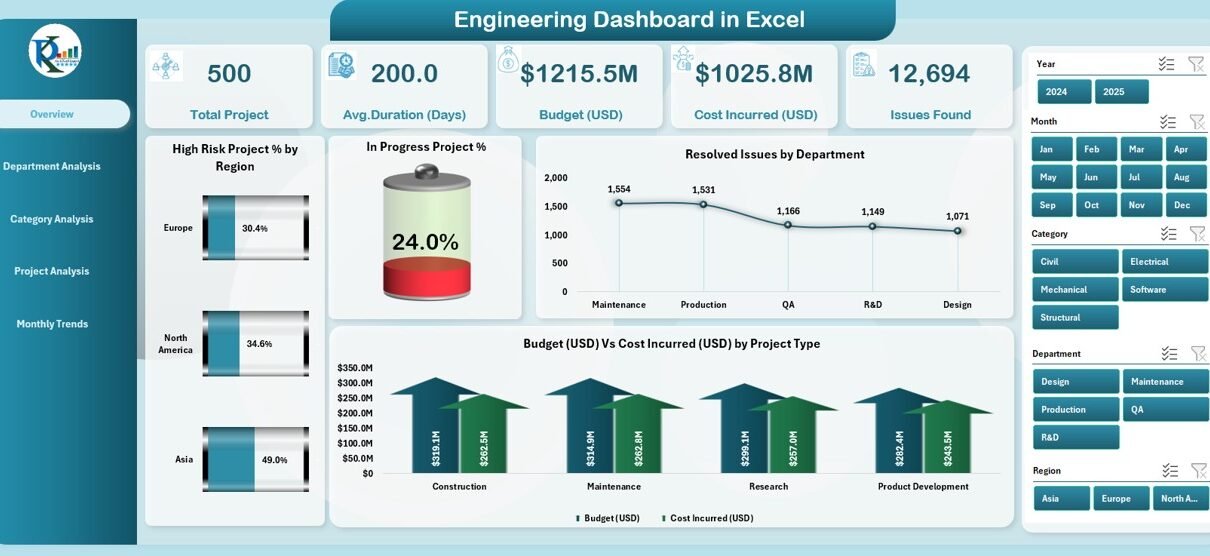
Engineering Dashboard in Excel

October 25, 2025October 25, 2025 PKComments Off on Engineering Dashboard in Excel
In today’s data-driven world, engineering teams handle multiple projects, budgets, resources, and risks at the same time. Managing all this information manually can quickly become overwhelming. That’s where the Engineering
Read More
Dashboard

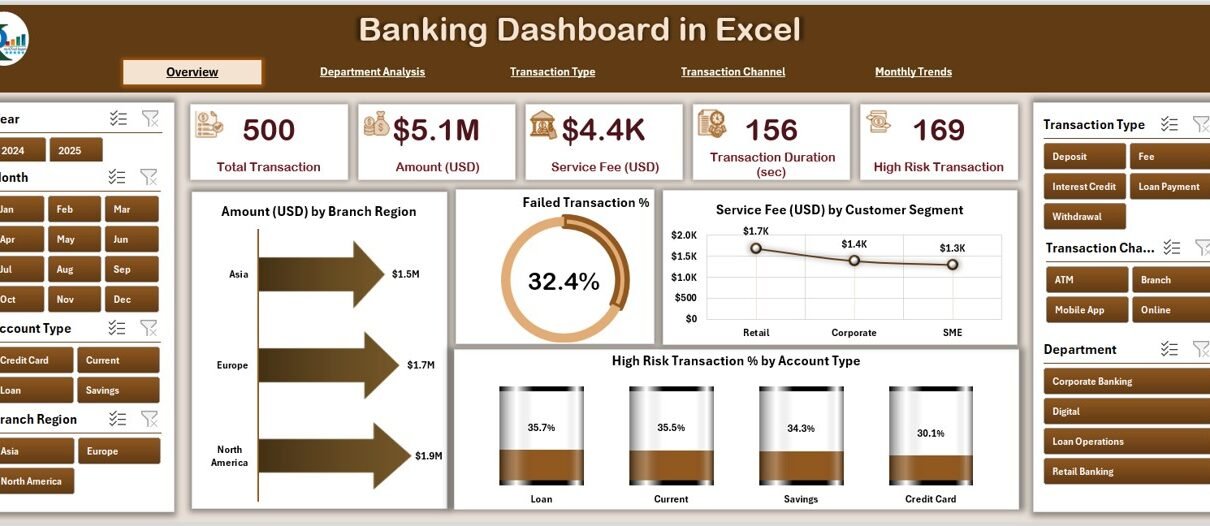
Banking Dashboard in Excel

October 14, 2025October 14, 2025 PKComments Off on Banking Dashboard in Excel
The banking industry runs on data — from customer transactions to branch profitability. However, with data spread across multiple reports, spreadsheets, and systems, decision-making often becomes slow and complex.A Banking
Read More
Templates VBA

Quality Control Tracker in Excel

July 27, 2025July 27, 2025 PKComments Off on Quality Control Tracker in Excel
In today’s fast-paced business environment, ensuring consistent product and service quality is crucial for long-term success. However, many organizations still rely on manual logs or outdated systems to manage their
Read More
Dashboard

Supply Chain Dashboard in Excel

July 20, 2025July 20, 2025 PKComments Off on Supply Chain Dashboard in Excel
Effective supply chain management is crucial for businesses to optimize their operations, reduce costs, and enhance customer satisfaction. One of the most effective ways to manage supply chains efficiently is
Read More
Dashboard

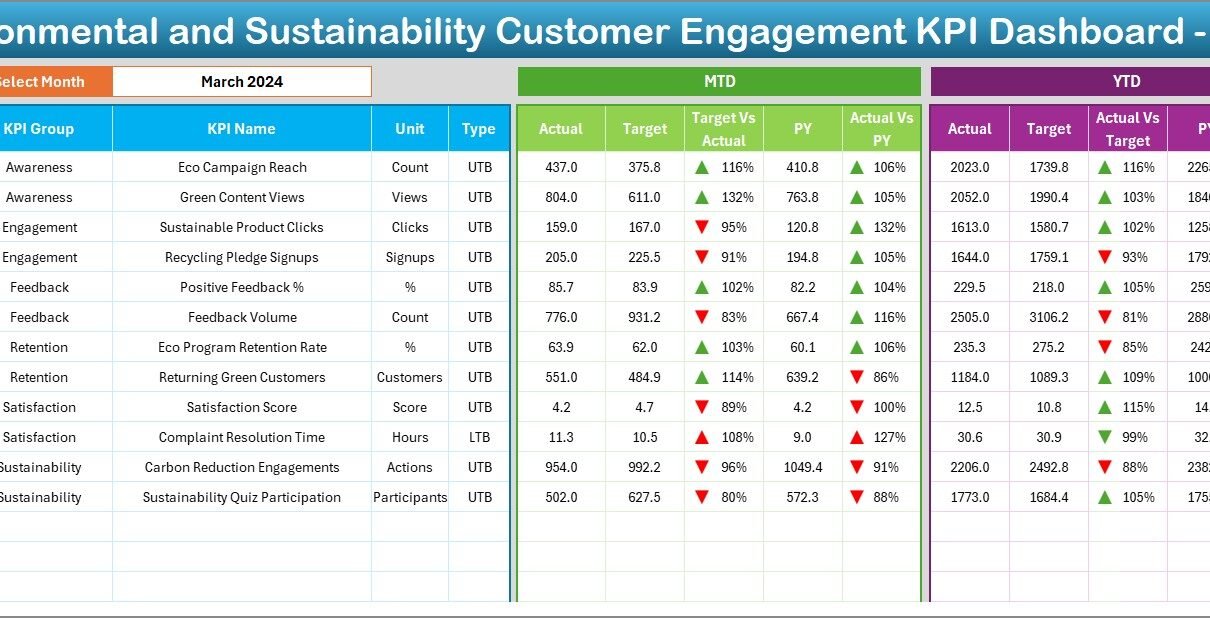
Environmental and Sustainability Customer Engagement KPI Dashboard in Excel

July 10, 2025July 10, 2025 PKComments Off on Environmental and Sustainability Customer Engagement KPI Dashboard in Excel
In today’s eco-conscious world, businesses are not just judged by their profits but also by their environmental impact and sustainability practices. Customers are more inclined to engage with brands that
Read More
Dashboard

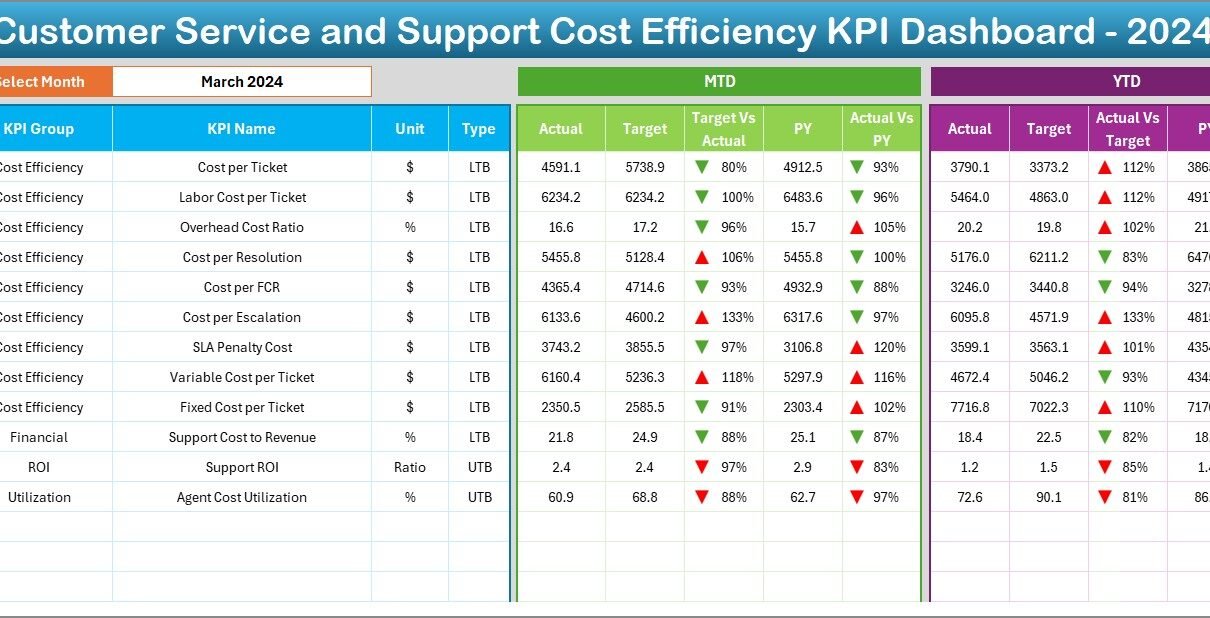
Customer Service and Support Cost Efficiency KPI Dashboard in Excel

June 27, 2025June 27, 2025 PKComments Off on Customer Service and Support Cost Efficiency KPI Dashboard in Excel
A Customer Service and Support Cost Efficiency KPI Dashboard is a data visualization tool built in Excel that tracks and displays key performance indicators (KPIs) related to the cost-effectiveness of
Read More

Posts pagination

Previous 1 2 3 Next
  • Learn Excel (Free Course)
    • 1. Shortcut Keys
    • 2. Fill & Flash Fill
    • 3. Find & Replace
    • 4. Sort & Filter
    • 5. Formulas & Functions
    • 6. Data Validation
    • 7. Conditional Formatting
    • 8. Basic Charts
    • 9. Advanced Charts
    • 10. Pivot Tables
    • 11. Excel Dashboards
    • 12. VBA Course
    • 13. Excel Formulas with AI
  • Templates
  • Tutorials
    • Charts and Visualization
    • VBA
    • Excel Tips and Tricks
    • Excel Dashboards
    • Power Pivot & DAX
  • Power BI
  • Template Store
    • Ready to Use Templates
  • Courses
  • Academy
    • Excel + AI Mastery: 100 Formulas
    • Excel Pivot Tables & Dashboards
  • About Us
  • Contact Us
Copyright © 2023 PK-AnExcelExpert.com - Privacy Policy