New: NextGenTemplates Academy - video courses on Excel formulas with AI and Pivot Tables & dashboards. Early-bird: 20% off with code EARLYBIRD20 - first 20 orders only. See the courses →
  • Learn Excel (Free Course)
    • 1. Shortcut Keys
    • 2. Fill & Flash Fill
    • 3. Find & Replace
    • 4. Sort & Filter
    • 5. Formulas & Functions
    • 6. Data Validation
    • 7. Conditional Formatting
    • 8. Basic Charts
    • 9. Advanced Charts
    • 10. Pivot Tables
    • 11. Excel Dashboards
    • 12. VBA Course
    • 13. Excel Formulas with AI
  • Templates
  • Tutorials
    • Charts and Visualization
    • VBA
    • Excel Tips and Tricks
    • Excel Dashboards
    • Power Pivot & DAX
  • Power BI
  • Template Store
    • Ready to Use Templates
  • Courses
  • Academy
    • Excel + AI Mastery: 100 Formulas
    • Excel Pivot Tables & Dashboards
  • About Us
  • Contact Us

PK: An Excel Expert

Transforming Data into Decisions

Tag: Excel dashboard template

Dashboard

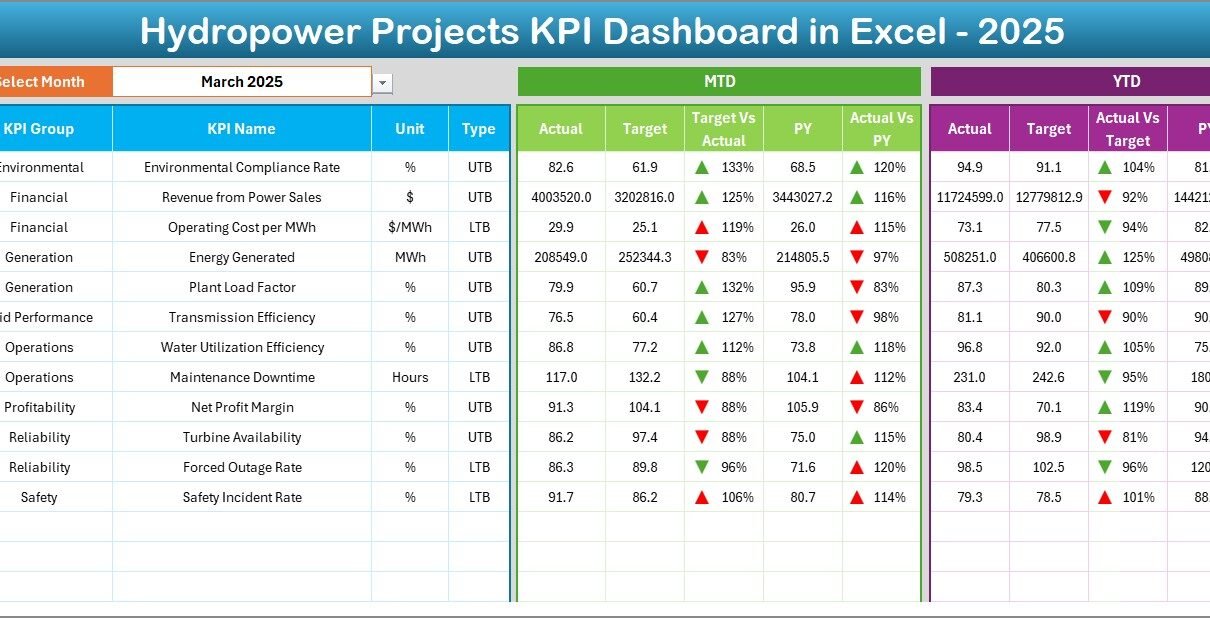
Hydropower Projects KPI Dashboard in Excel

March 2, 2026March 2, 2026 PKComments Off on Hydropower Projects KPI Dashboard in Excel
Hydropower projects play a critical role in sustainable energy generation across the world. Governments, private developers, and energy companies invest heavily in hydropower plants to produce clean electricity while reducing
Read More
Dashboard

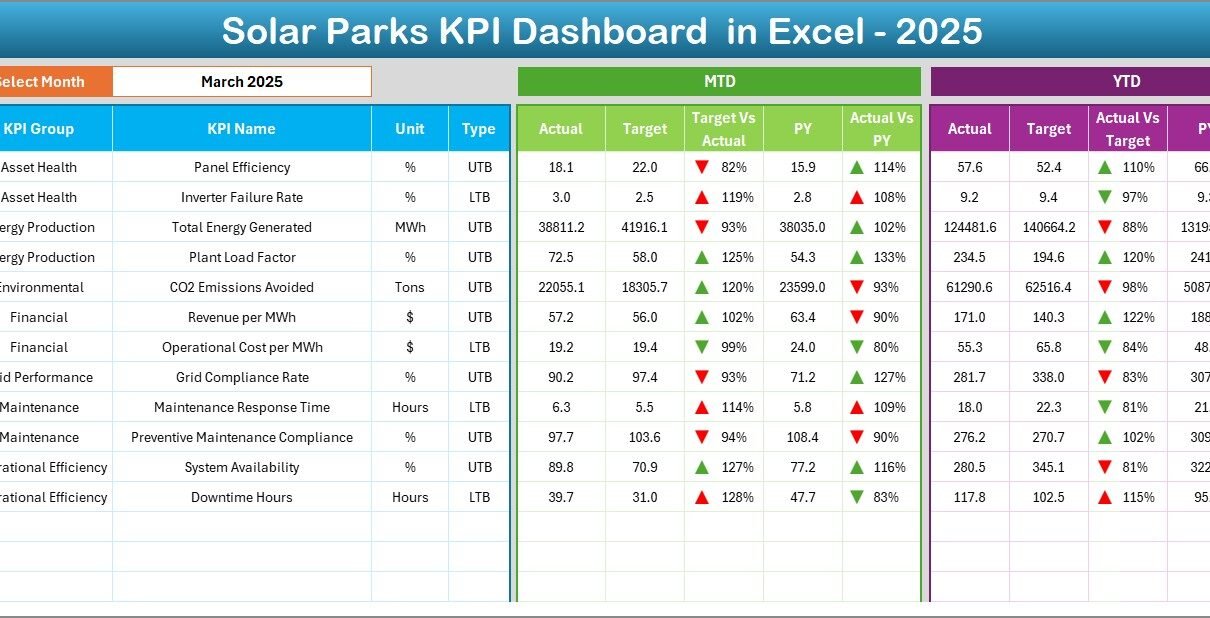
Solar Parks KPI Dashboard in Excel

March 2, 2026March 2, 2026 PKComments Off on Solar Parks KPI Dashboard in Excel
The renewable energy industry continues to grow rapidly, and solar parks now play a major role in global electricity production. However, managing solar park operations requires continuous monitoring, accurate reporting,
Read More
Dashboard

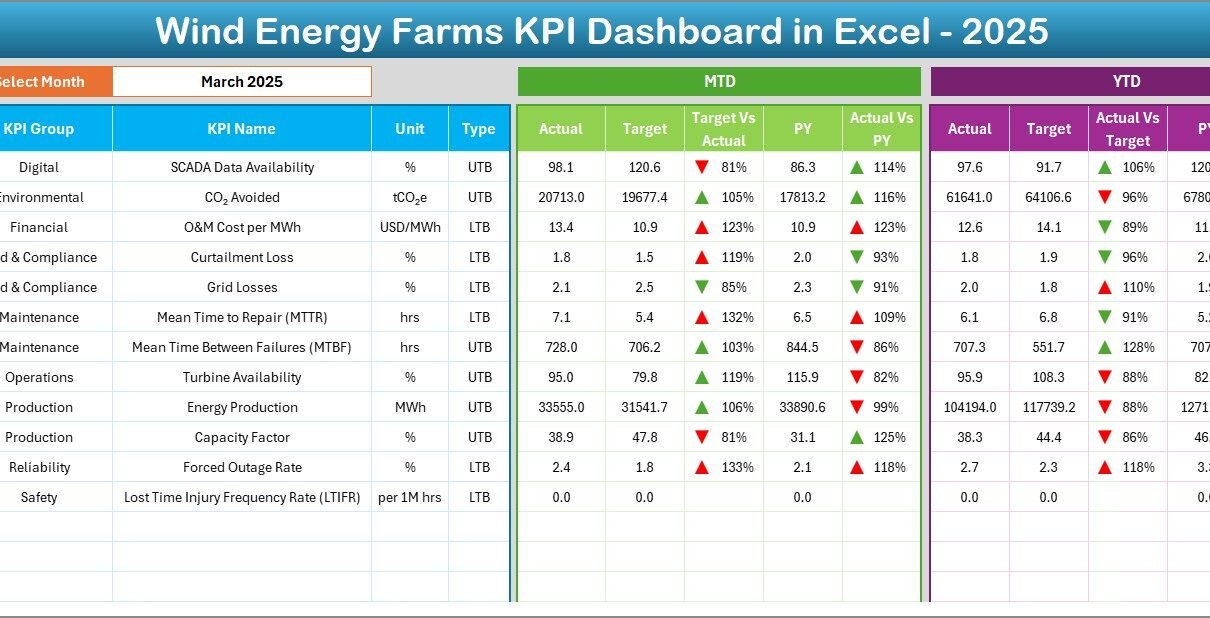
Wind Energy Farms KPI Dashboard in Excel

March 1, 2026March 1, 2026 PKComments Off on Wind Energy Farms KPI Dashboard in Excel
Wind energy continues to grow rapidly across the world. Governments, private investors, and renewable energy companies invest heavily in wind farms to produce clean electricity and reduce carbon emissions. However,
Read More
Dashboard

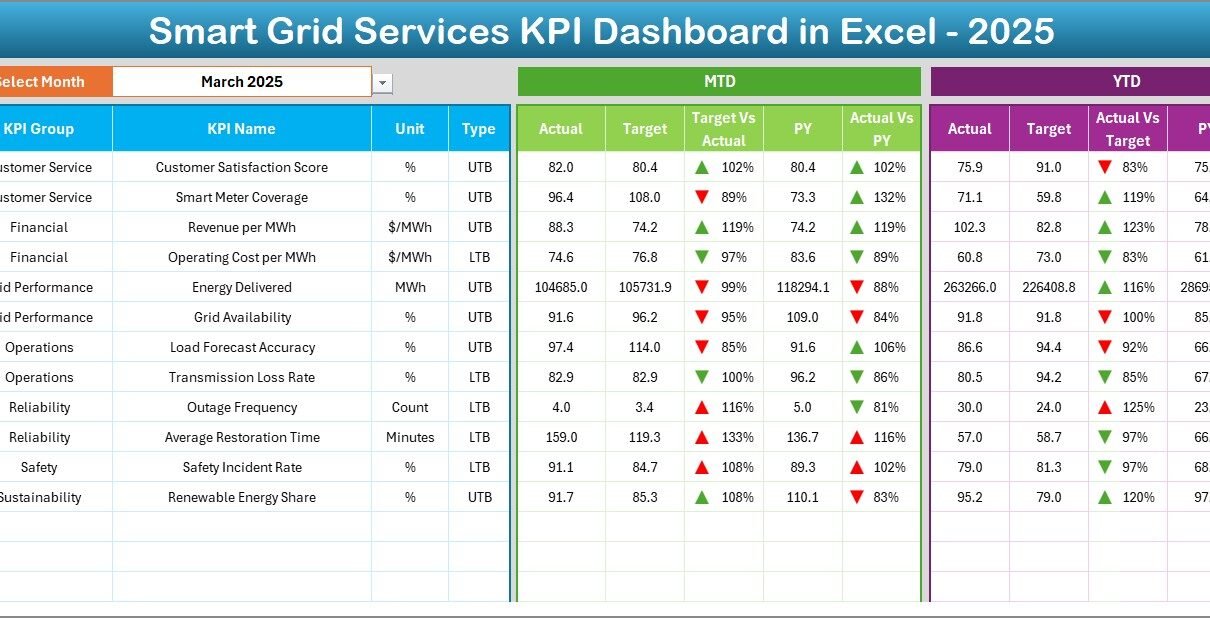
Smart Grid Services KPI Dashboard in Excel

March 1, 2026March 1, 2026 PKComments Off on Smart Grid Services KPI Dashboard in Excel
Smart grid services keep modern power systems reliable, efficient, and ready for the future. However, many utility teams still track performance using scattered files, email updates, and different tools. As
Read More
Templates

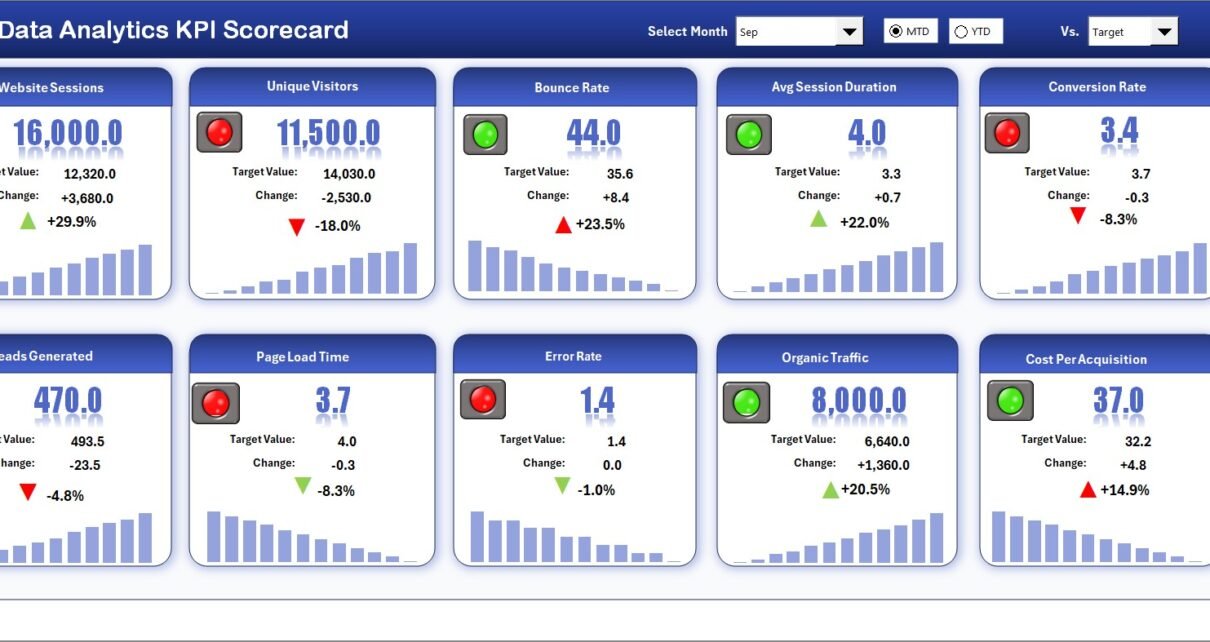
Data Analytics KPI Scorecard in Excel

February 28, 2026February 28, 2026 PKComments Off on Data Analytics KPI Scorecard in Excel
In today’s data-driven business environment, organizations rely heavily on data analytics to make smarter decisions, improve operational efficiency, and gain competitive advantages. Companies collect massive volumes of data every day.
Read More
Templates

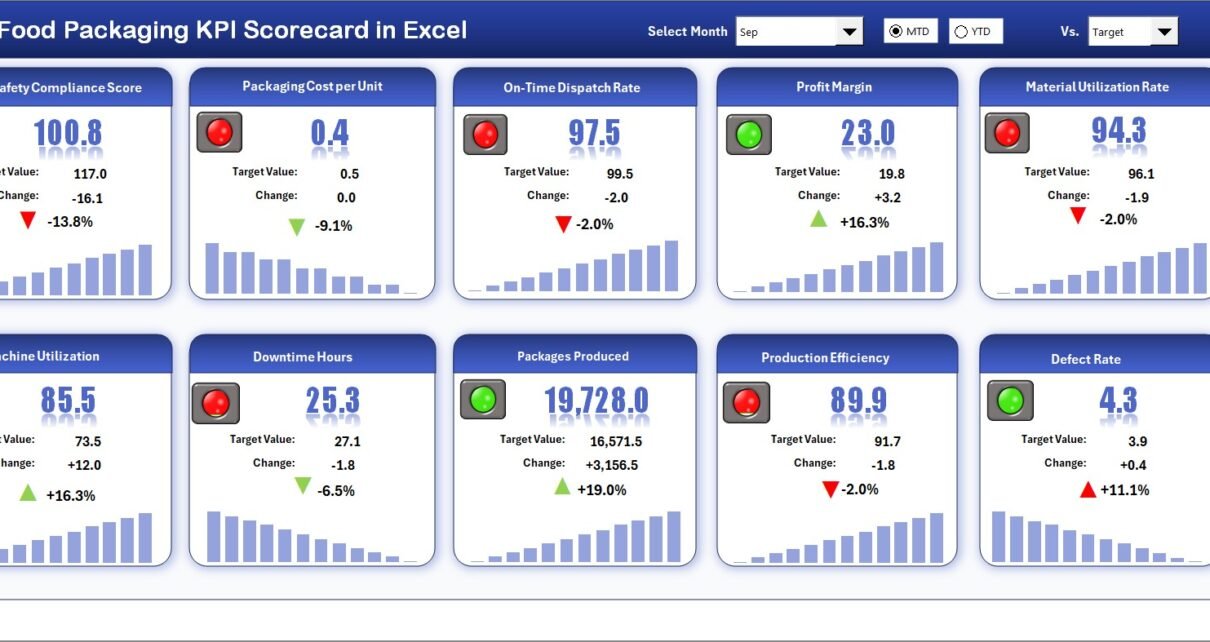
Food Packaging KPI Scorecard in Excel

February 28, 2026February 28, 2026 PKComments Off on Food Packaging KPI Scorecard in Excel
In today’s highly competitive food industry, companies must maintain quality, safety, efficiency, and compliance at every stage of production. Packaging plays a critical role because it directly impacts product freshness,
Read More
Templates

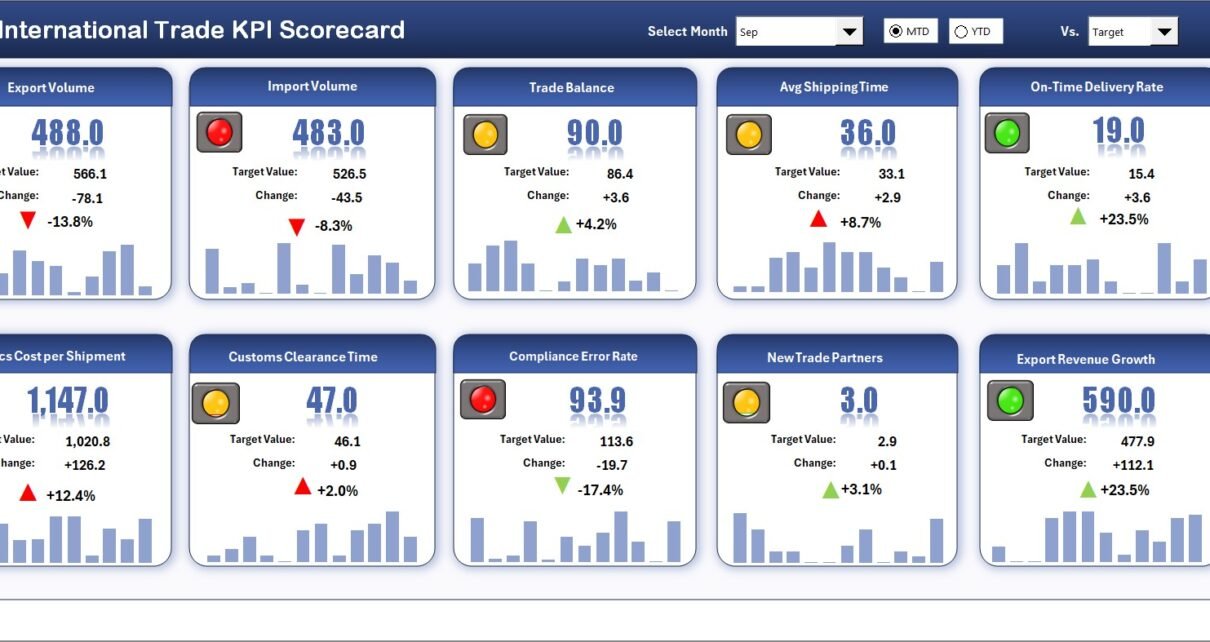
International Trade KPI Scorecard in Excel

February 28, 2026February 28, 2026 PKComments Off on International Trade KPI Scorecard in Excel
In today’s highly connected global economy, international trade organizations must continuously monitor performance across exports, imports, logistics, compliance, and operational efficiency. However, many companies still rely on disconnected spreadsheets and
Read More
Templates

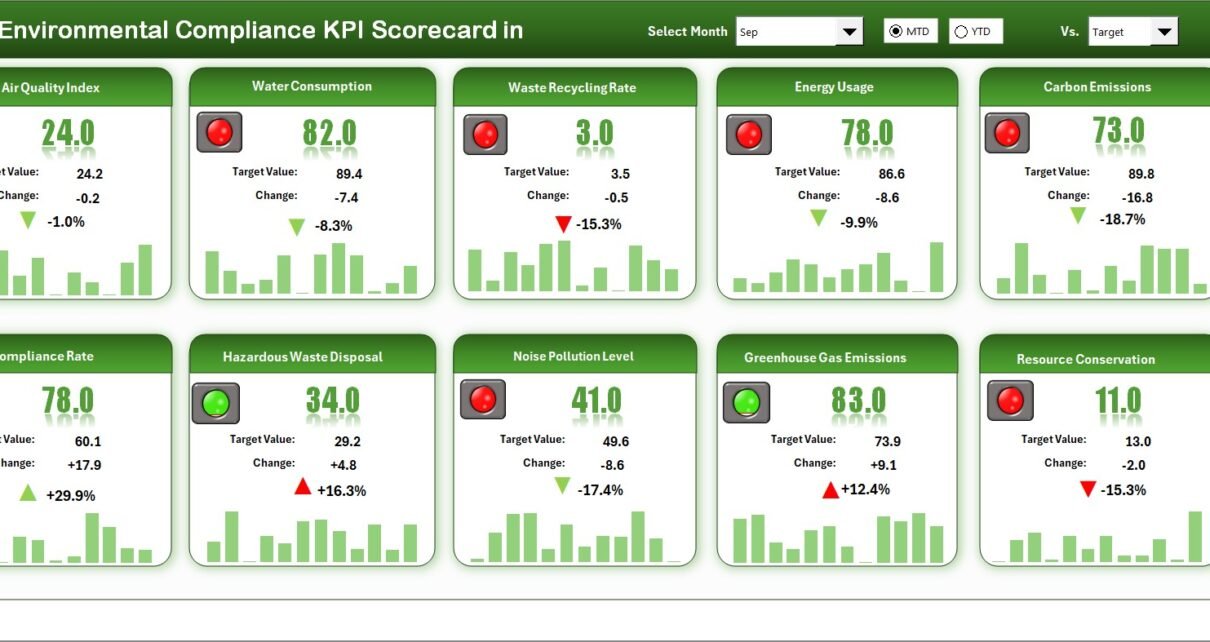
Environmental Compliance KPI Scorecard in Excel

February 27, 2026February 27, 2026 PKComments Off on Environmental Compliance KPI Scorecard in Excel
In today’s business environment, organizations must operate responsibly while meeting environmental regulations and sustainability goals. Governments enforce strict compliance standards, stakeholders expect transparency, and customers prefer environmentally responsible companies. Therefore,
Read More
Dashboard

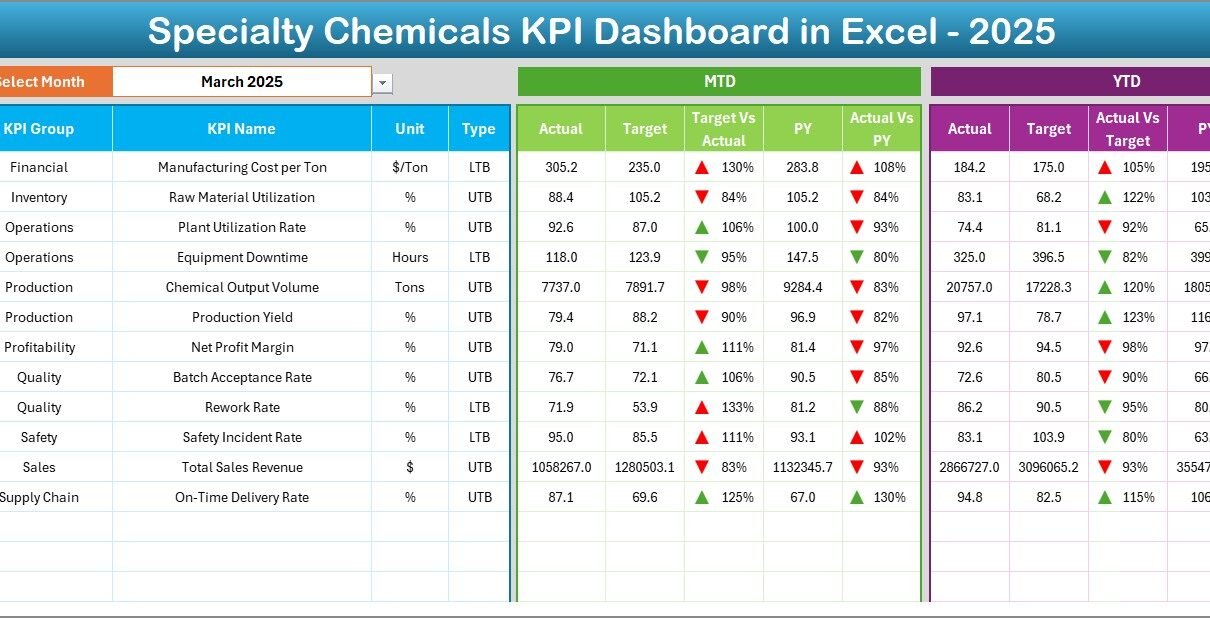
Specialty Chemicals KPI Dashboard in Excel

February 27, 2026February 27, 2026 PKComments Off on Specialty Chemicals KPI Dashboard in Excel
In today’s highly competitive chemical industry, companies must monitor production efficiency, quality performance, safety compliance, and financial outcomes continuously. However, many specialty chemical manufacturers still rely on scattered spreadsheets and
Read More
Dashboard

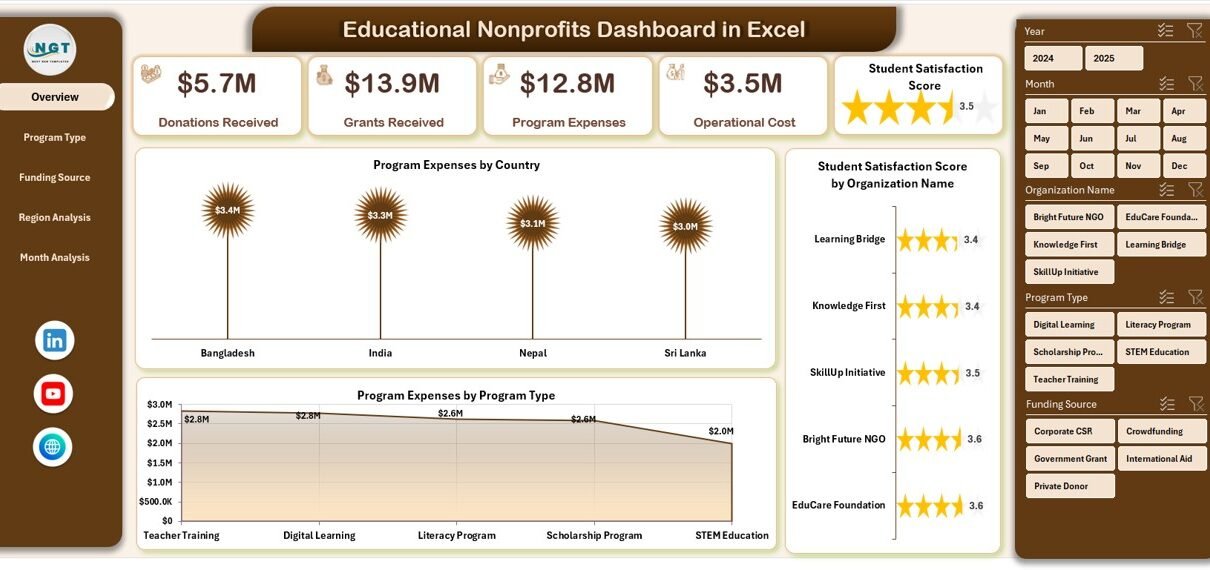
Educational Nonprofits Dashboard in Excel

February 26, 2026February 26, 2026 PKComments Off on Educational Nonprofits Dashboard in Excel
Educational nonprofits play a vital role in shaping communities, supporting students, and improving access to learning opportunities. However, managing programs, tracking donations, monitoring expenses, and measuring impact often becomes challenging
Read More

Posts pagination

Previous 1 … 6 7 8 … 28 Next
  • Learn Excel (Free Course)
    • 1. Shortcut Keys
    • 2. Fill & Flash Fill
    • 3. Find & Replace
    • 4. Sort & Filter
    • 5. Formulas & Functions
    • 6. Data Validation
    • 7. Conditional Formatting
    • 8. Basic Charts
    • 9. Advanced Charts
    • 10. Pivot Tables
    • 11. Excel Dashboards
    • 12. VBA Course
    • 13. Excel Formulas with AI
  • Templates
  • Tutorials
    • Charts and Visualization
    • VBA
    • Excel Tips and Tricks
    • Excel Dashboards
    • Power Pivot & DAX
  • Power BI
  • Template Store
    • Ready to Use Templates
  • Courses
  • Academy
    • Excel + AI Mastery: 100 Formulas
    • Excel Pivot Tables & Dashboards
  • About Us
  • Contact Us
Copyright © 2023 PK-AnExcelExpert.com - Privacy Policy