New: NextGenTemplates Academy - video courses on Excel formulas with AI and Pivot Tables & dashboards. Early-bird: 20% off with code EARLYBIRD20 - first 20 orders only. See the courses →
  • Learn Excel (Free Course)
    • 1. Shortcut Keys
    • 2. Fill & Flash Fill
    • 3. Find & Replace
    • 4. Sort & Filter
    • 5. Formulas & Functions
    • 6. Data Validation
    • 7. Conditional Formatting
    • 8. Basic Charts
    • 9. Advanced Charts
    • 10. Pivot Tables
    • 11. Excel Dashboards
    • 12. VBA Course
    • 13. Excel Formulas with AI
  • Templates
  • Tutorials
    • Charts and Visualization
    • VBA
    • Excel Tips and Tricks
    • Excel Dashboards
    • Power Pivot & DAX
  • Power BI
  • Template Store
    • Ready to Use Templates
  • Courses
  • Academy
    • Excel + AI Mastery: 100 Formulas
    • Excel Pivot Tables & Dashboards
  • About Us
  • Contact Us

PK: An Excel Expert

Transforming Data into Decisions

Tag: Excel data model

Templates

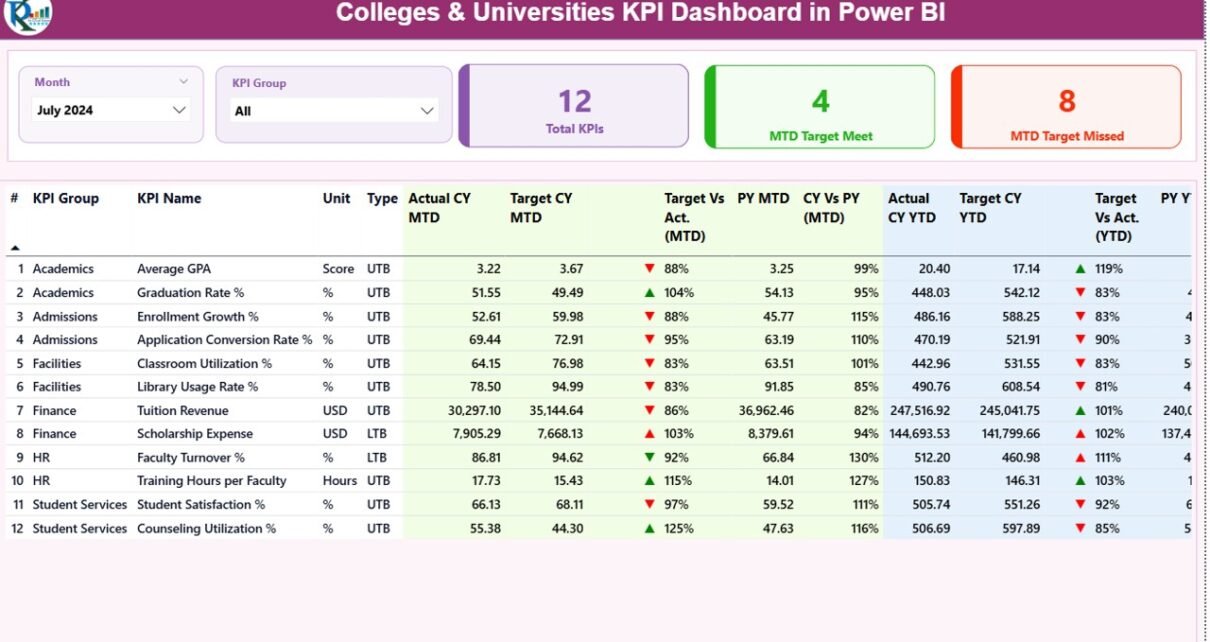
Colleges & Universities KPI Dashboard in Power BI

December 4, 2025December 4, 2025 PKComments Off on Colleges & Universities KPI Dashboard in Power BI
Running a college or university involves hundreds of activities every month. Academic performance, student admissions, staff efficiency, research output, attendance, operational costs, and administrative quality all demand constant attention. Because
Read More
Dashboard Power BI

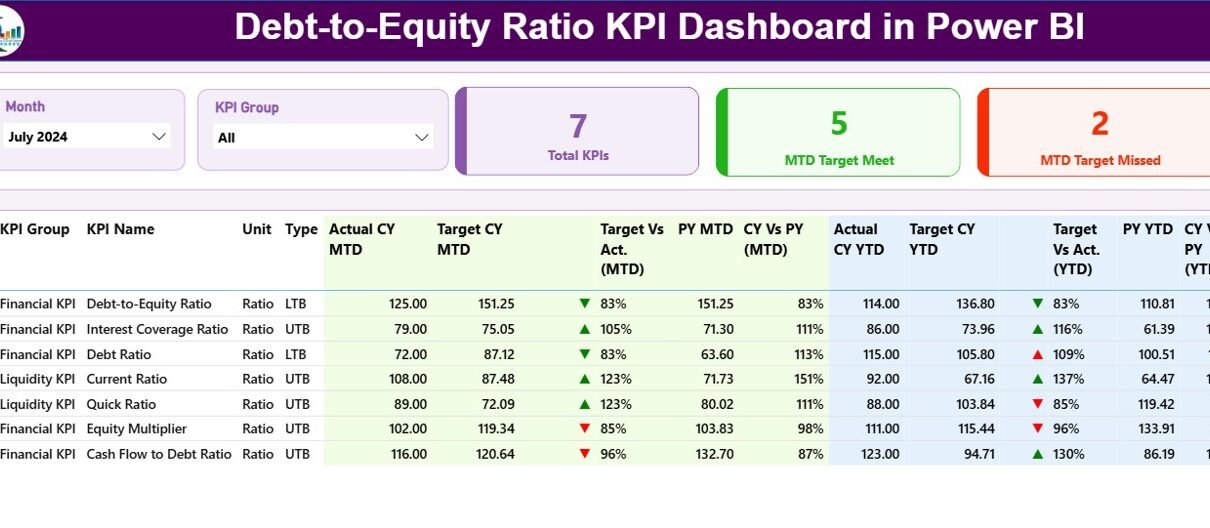
Debt-to-Equity Ratio KPI Dashboard in Power BI

December 4, 2025December 4, 2025 PKComments Off on Debt-to-Equity Ratio KPI Dashboard in Power BI
Financial performance becomes clear when you track the right KPIs. The Debt-to-Equity Ratio is one of the most important financial indicators because it shows the stability and long-term strength of
Read More
Templates

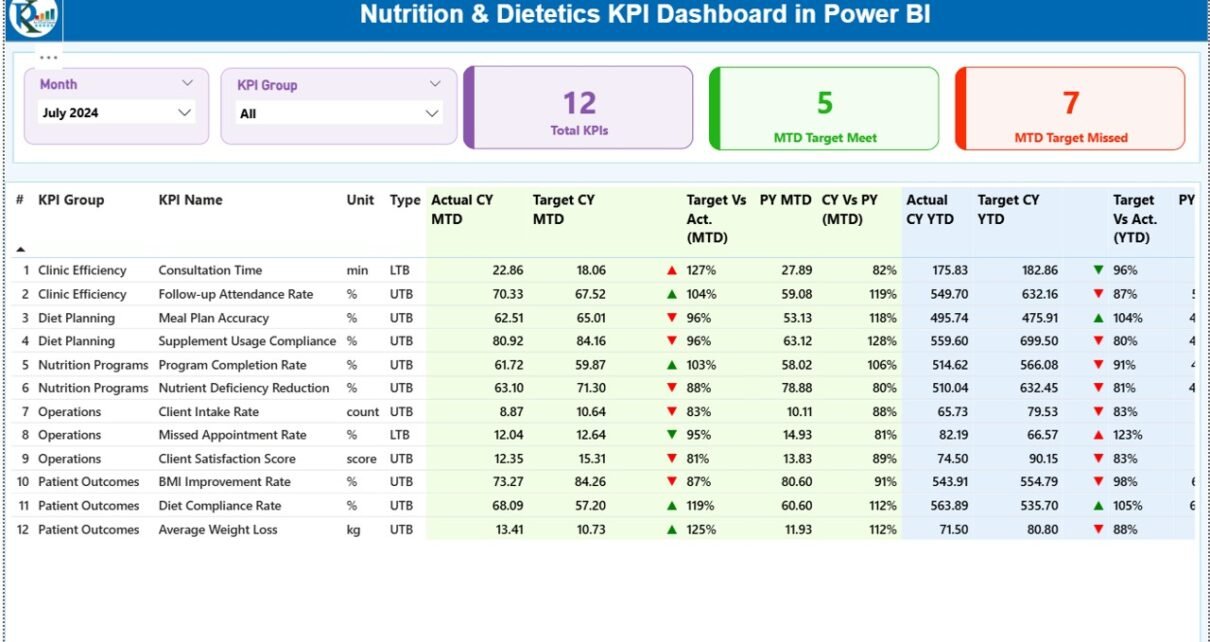
Nutrition & Dietetics KPI Dashboard in Power BI

December 3, 2025December 3, 2025 PKComments Off on Nutrition & Dietetics KPI Dashboard in Power BI
Managing the performance of nutrition and dietetics programs becomes easier when you use the right analytical tools. Dietitians, nutrition managers, and healthcare planners deal with many performance indicators every month.
Read More
Dashboard Power BI

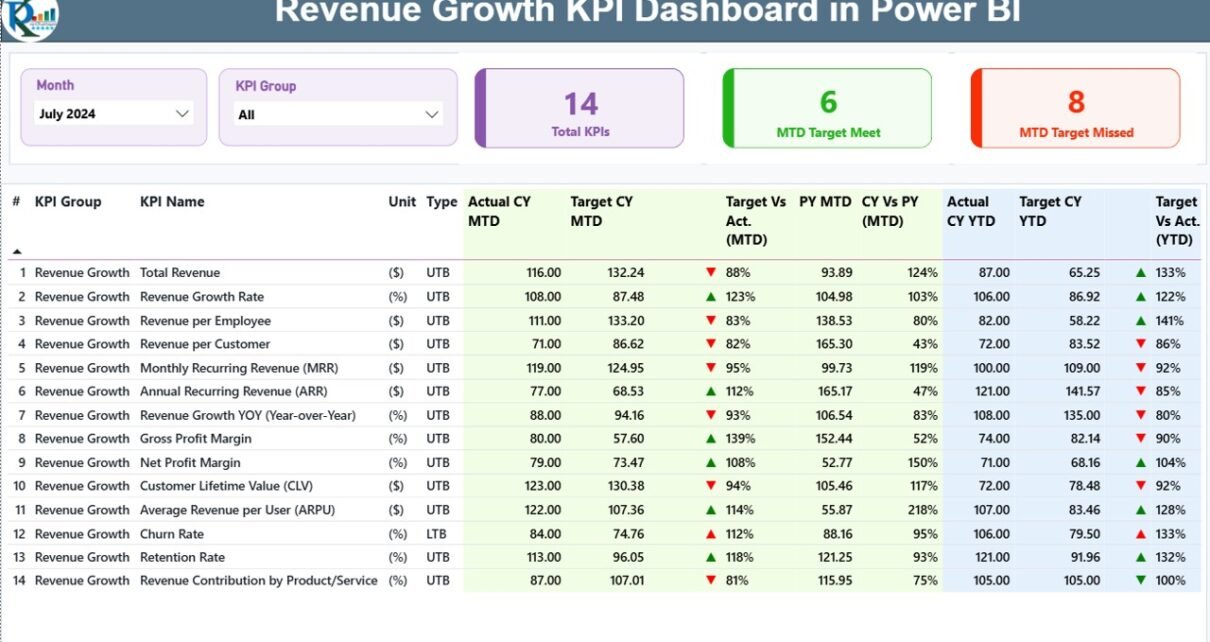
Revenue Growth KPI Dashboard in Power BI

December 3, 2025December 3, 2025 PKComments Off on Revenue Growth KPI Dashboard in Power BI
Businesses need fast and clear insights to grow their revenue. Sales change every month, new products enter the market, customer behaviour shifts often, and marketing teams run many campaigns. Because
Read More
  • Learn Excel (Free Course)
    • 1. Shortcut Keys
    • 2. Fill & Flash Fill
    • 3. Find & Replace
    • 4. Sort & Filter
    • 5. Formulas & Functions
    • 6. Data Validation
    • 7. Conditional Formatting
    • 8. Basic Charts
    • 9. Advanced Charts
    • 10. Pivot Tables
    • 11. Excel Dashboards
    • 12. VBA Course
    • 13. Excel Formulas with AI
  • Templates
  • Tutorials
    • Charts and Visualization
    • VBA
    • Excel Tips and Tricks
    • Excel Dashboards
    • Power Pivot & DAX
  • Power BI
  • Template Store
    • Ready to Use Templates
  • Courses
  • Academy
    • Excel + AI Mastery: 100 Formulas
    • Excel Pivot Tables & Dashboards
  • About Us
  • Contact Us
Copyright © 2023 PK-AnExcelExpert.com - Privacy Policy