New: NextGenTemplates Academy - video courses on Excel formulas with AI and Pivot Tables & dashboards. Early-bird: 20% off with code EARLYBIRD20 - first 20 orders only. See the courses →
  • Learn Excel (Free Course)
    • 1. Shortcut Keys
    • 2. Fill & Flash Fill
    • 3. Find & Replace
    • 4. Sort & Filter
    • 5. Formulas & Functions
    • 6. Data Validation
    • 7. Conditional Formatting
    • 8. Basic Charts
    • 9. Advanced Charts
    • 10. Pivot Tables
    • 11. Excel Dashboards
    • 12. VBA Course
    • 13. Excel Formulas with AI
  • Templates
  • Tutorials
    • Charts and Visualization
    • VBA
    • Excel Tips and Tricks
    • Excel Dashboards
    • Power Pivot & DAX
  • Power BI
  • Template Store
    • Ready to Use Templates
  • Courses
  • Academy
    • Excel + AI Mastery: 100 Formulas
    • Excel Pivot Tables & Dashboards
  • About Us
  • Contact Us

PK: An Excel Expert

Transforming Data into Decisions

Tag: Excel Data Power BI

Power BI

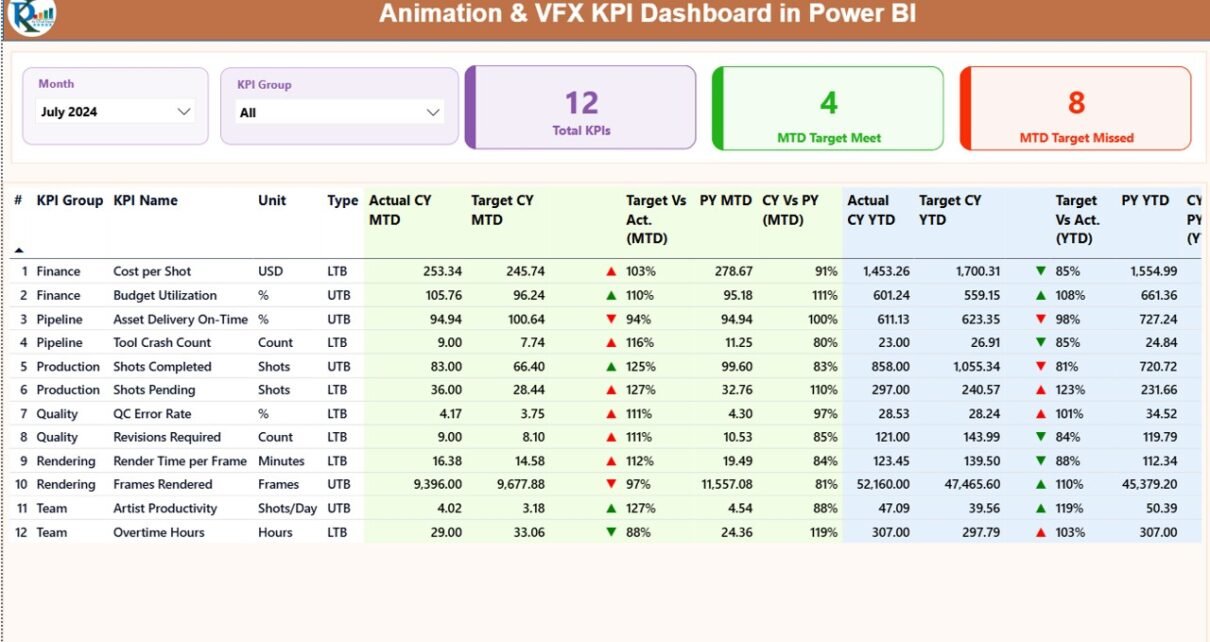
Animation & VFX KPI Dashboard in Power BI

December 13, 2025December 13, 2025 PKComments Off on Animation & VFX KPI Dashboard in Power BI
In today’s fast-moving animation and visual effects industry, studios face constant pressure to deliver high-quality output on time and within budget. At the same time, creative leaders, production managers, and
Read More
Dashboard Power BI

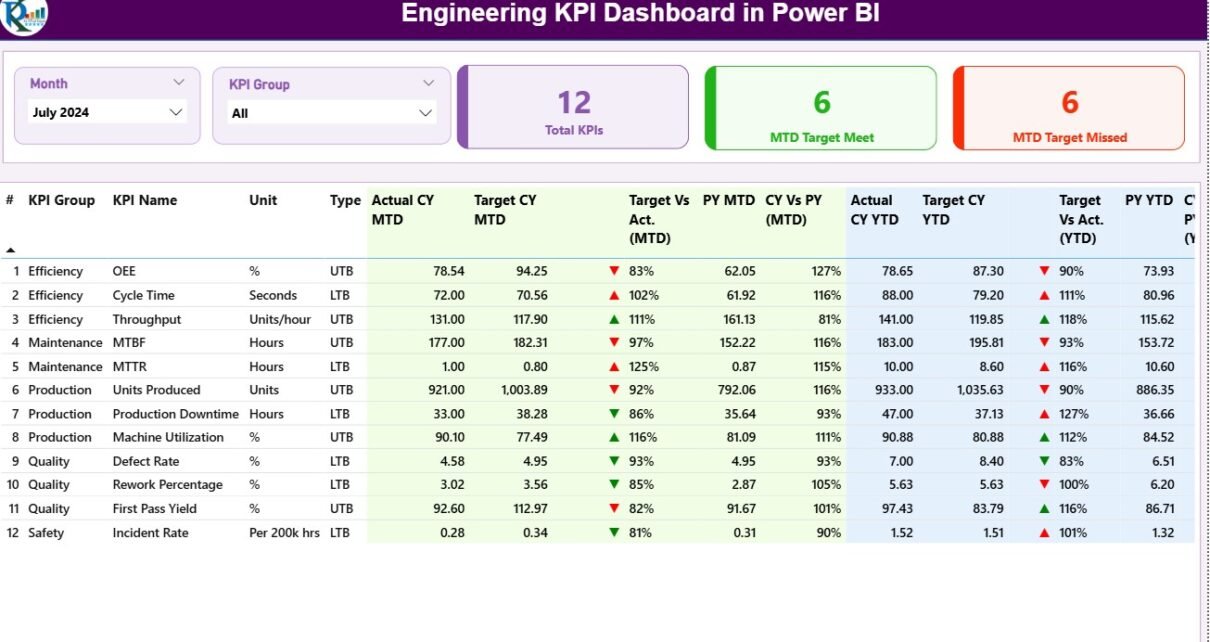
Engineering KPI Dashboard in Power BI

October 17, 2025October 17, 2025 PKComments Off on Engineering KPI Dashboard in Power BI
In today’s fast-moving industrial world, engineering teams must maintain precision, productivity, and innovation — all while meeting tight deadlines and budgets. However, managing multiple performance indicators across departments can become
Read More
Dashboard Power BI

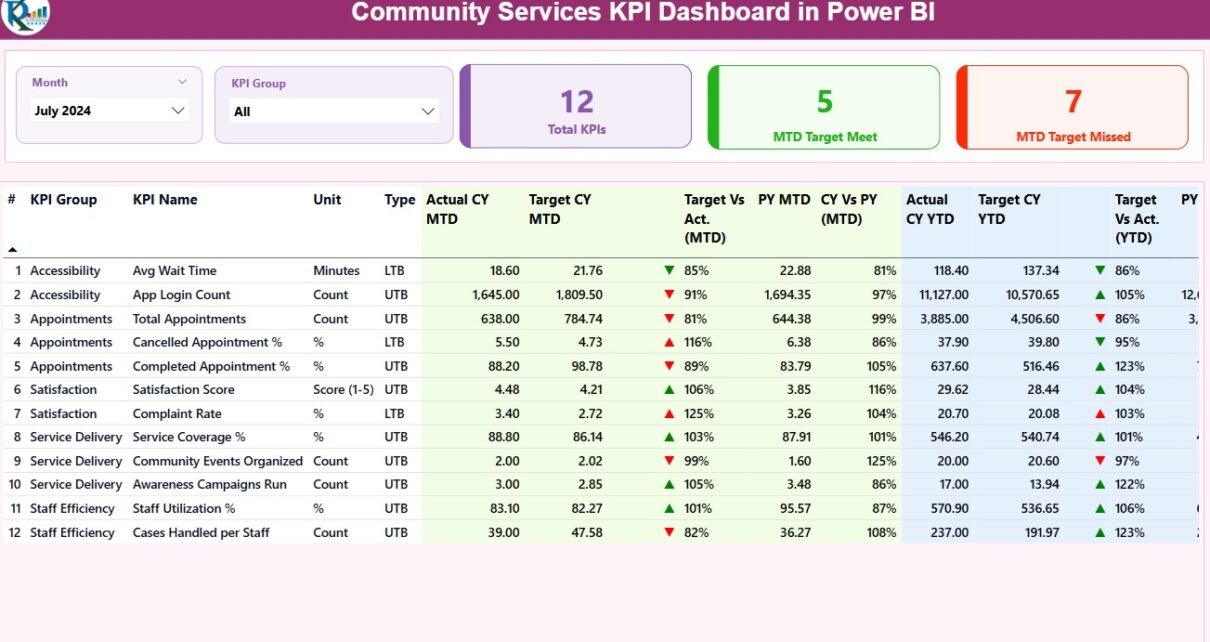
Community Services KPI Dashboard in Power BI

October 14, 2025October 14, 2025 PKComments Off on Community Services KPI Dashboard in Power BI
Managing community programs requires clear insights, measurable outcomes, and reliable data. The Community Services KPI Dashboard in Power BI provides a powerful way for organizations to track key performance indicators
Read More
Dashboard Power BI

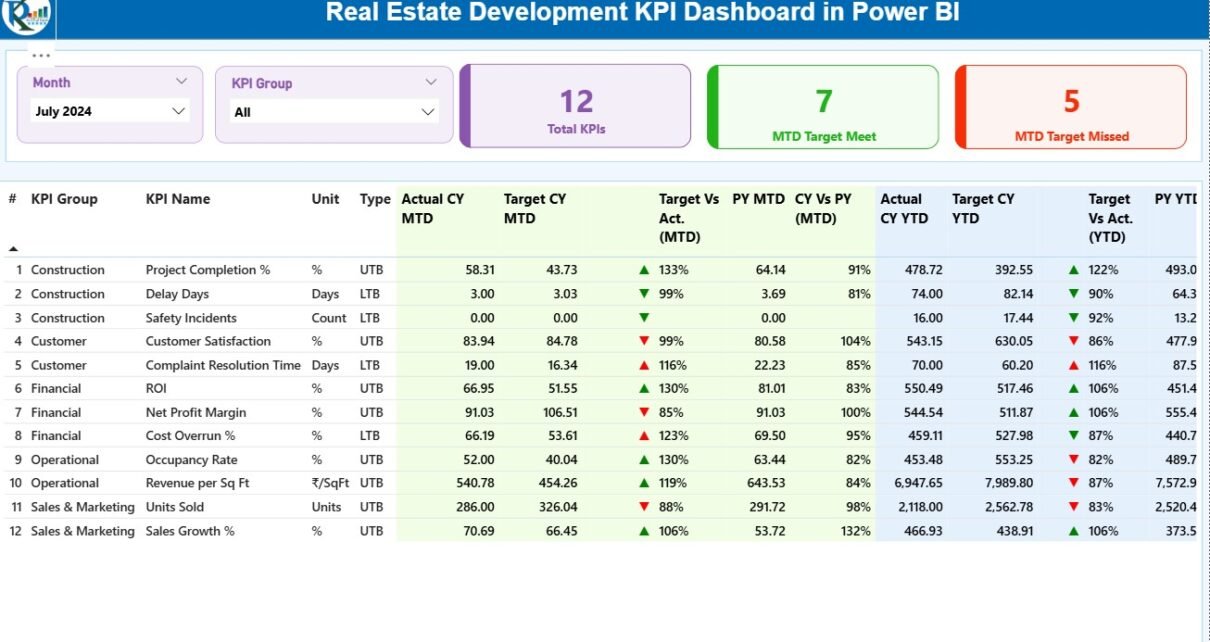
Real Estate Development KPI Dashboard in Power BI

October 13, 2025October 13, 2025 PKComments Off on Real Estate Development KPI Dashboard in Power BI
The real estate industry runs on complex data—project timelines, budgets, construction costs, occupancy rates, and investment returns. Managing this data manually can lead to inefficiencies, delayed decisions, and missed opportunities.
Read More
Dashboard Power BI

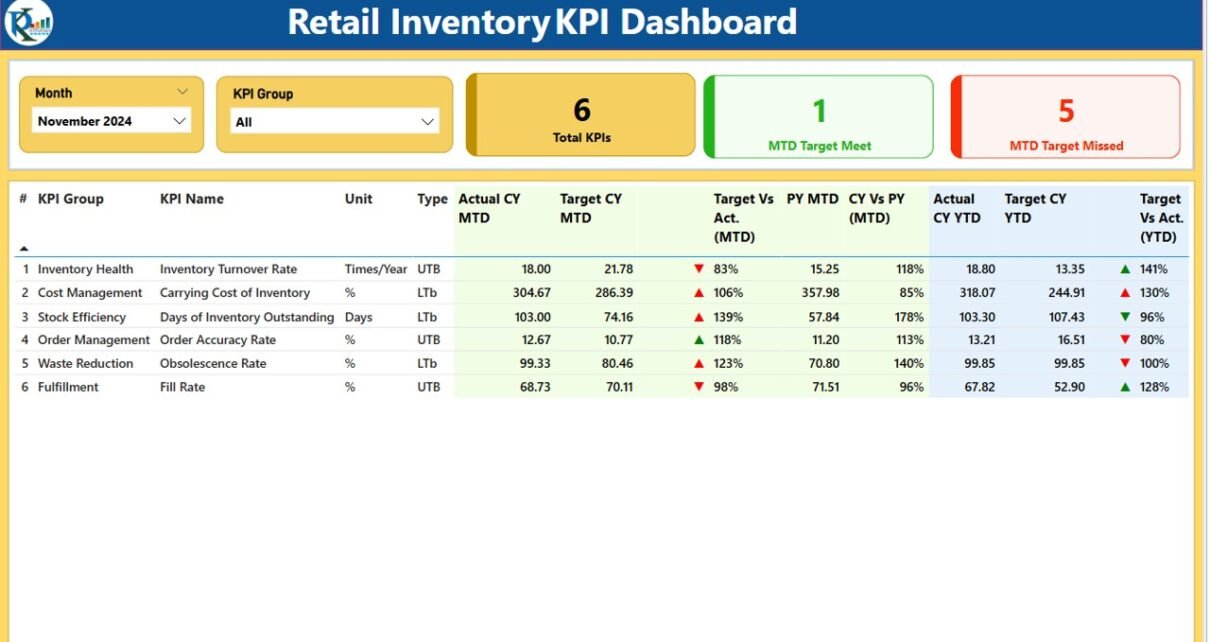
Retail Inventory KPI Dashboard in Power BI

June 2, 2025June 2, 2025 PKComments Off on Retail Inventory KPI Dashboard in Power BI
In the fast-paced world of retail, having a clear and real-time view of your inventory metrics is crucial. If you're tired of juggling spreadsheets and struggling to interpret scattered data,
Read More
  • Learn Excel (Free Course)
    • 1. Shortcut Keys
    • 2. Fill & Flash Fill
    • 3. Find & Replace
    • 4. Sort & Filter
    • 5. Formulas & Functions
    • 6. Data Validation
    • 7. Conditional Formatting
    • 8. Basic Charts
    • 9. Advanced Charts
    • 10. Pivot Tables
    • 11. Excel Dashboards
    • 12. VBA Course
    • 13. Excel Formulas with AI
  • Templates
  • Tutorials
    • Charts and Visualization
    • VBA
    • Excel Tips and Tricks
    • Excel Dashboards
    • Power Pivot & DAX
  • Power BI
  • Template Store
    • Ready to Use Templates
  • Courses
  • Academy
    • Excel + AI Mastery: 100 Formulas
    • Excel Pivot Tables & Dashboards
  • About Us
  • Contact Us
Copyright © 2023 PK-AnExcelExpert.com - Privacy Policy