New: NextGenTemplates Academy - video courses on Excel formulas with AI and Pivot Tables & dashboards. Early-bird: 20% off with code EARLYBIRD20 - first 20 orders only. See the courses →
  • Learn Excel (Free Course)
    • 1. Shortcut Keys
    • 2. Fill & Flash Fill
    • 3. Find & Replace
    • 4. Sort & Filter
    • 5. Formulas & Functions
    • 6. Data Validation
    • 7. Conditional Formatting
    • 8. Basic Charts
    • 9. Advanced Charts
    • 10. Pivot Tables
    • 11. Excel Dashboards
    • 12. VBA Course
    • 13. Excel Formulas with AI
  • Templates
  • Tutorials
    • Charts and Visualization
    • VBA
    • Excel Tips and Tricks
    • Excel Dashboards
    • Power Pivot & DAX
  • Power BI
  • Template Store
    • Ready to Use Templates
  • Courses
  • Academy
    • Excel + AI Mastery: 100 Formulas
    • Excel Pivot Tables & Dashboards
  • About Us
  • Contact Us

PK: An Excel Expert

Transforming Data into Decisions

Tag: Excel data visualization

Dashboard

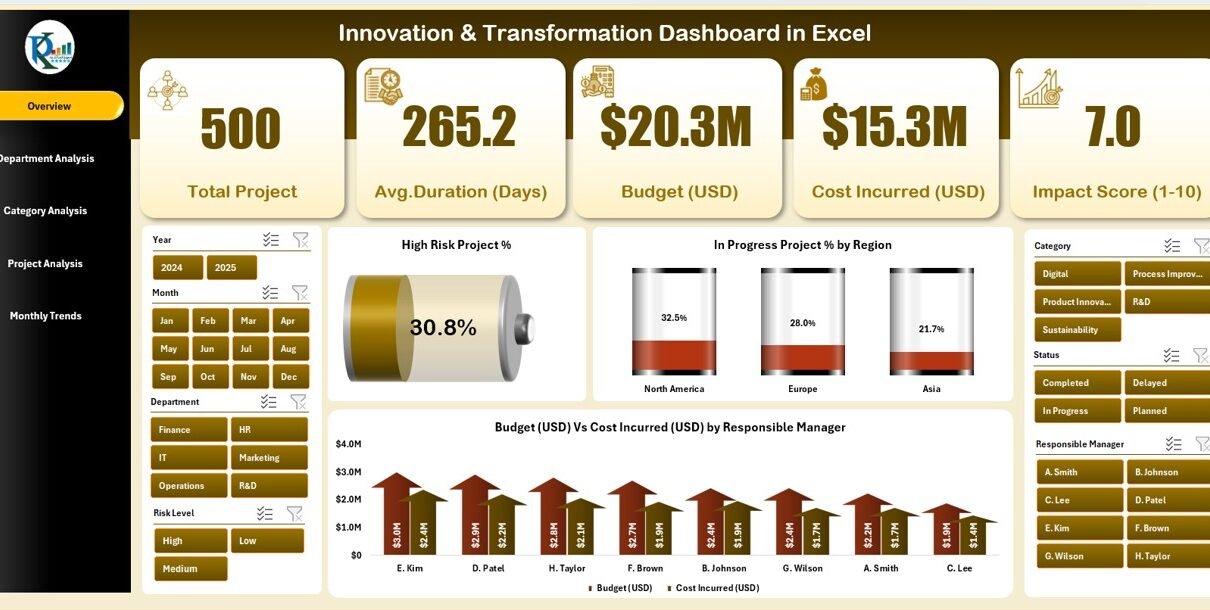
Innovation & Transformation Dashboard in Excel

October 26, 2025October 26, 2025 PKComments Off on Innovation & Transformation Dashboard in Excel
In today’s fast-changing business world, innovation and transformation are the core drivers of long-term success. Every organization—whether in technology, healthcare, manufacturing, or education—must constantly adapt, evolve, and improve its processes
Read More
Dashboard Power BI

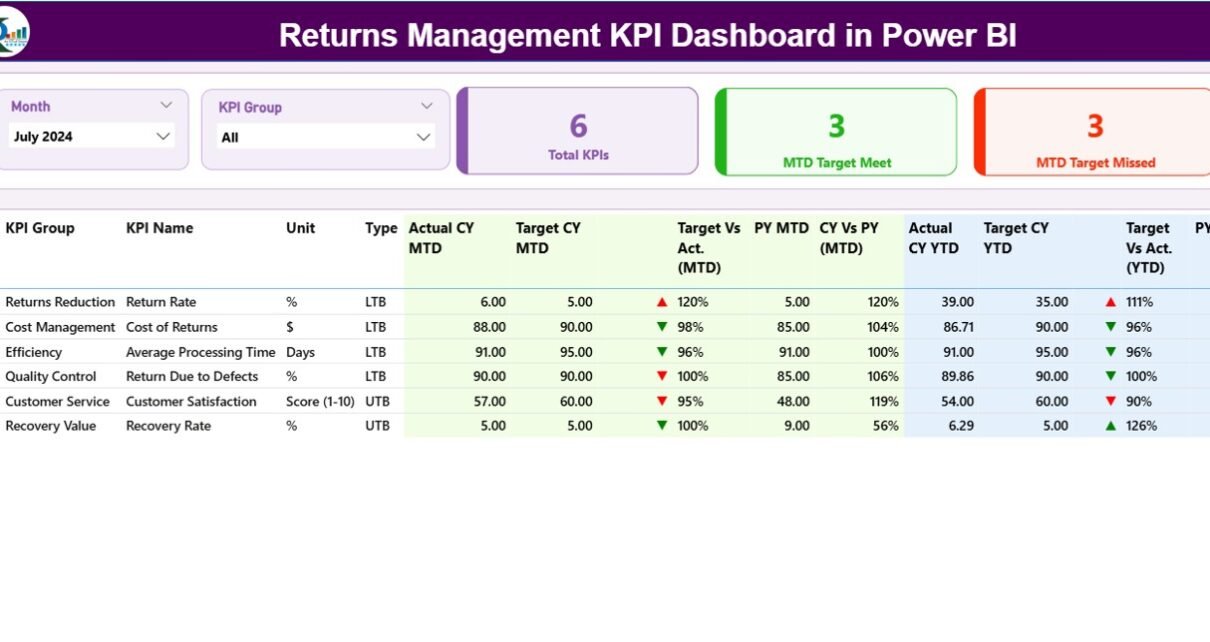
Returns Management KPI Dashboard in Power BI

October 13, 2025October 13, 2025 PKComments Off on Returns Management KPI Dashboard in Power BI
In today’s fast-paced retail and e-commerce environment, product returns play a major role in defining a company’s operational efficiency and customer satisfaction. Managing returns effectively is not just about processing
Read More
Dashboard Power BI

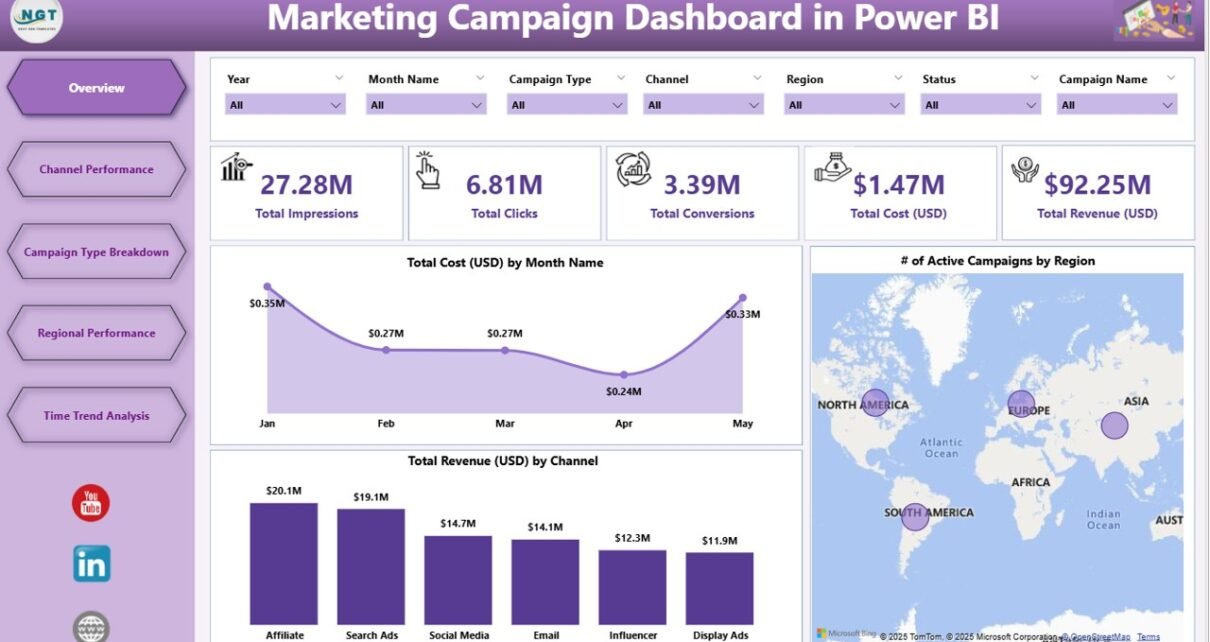
Marketing Campaign Dashboard in Power BI

July 29, 2025July 29, 2025 PKComments Off on Marketing Campaign Dashboard in Power BI
In today’s fast-paced digital world, marketing teams must make quick and data-driven decisions. Whether you run paid ads, email marketing, or multi-channel campaigns, knowing what’s working (and what’s not) is
Read More
Dashboard

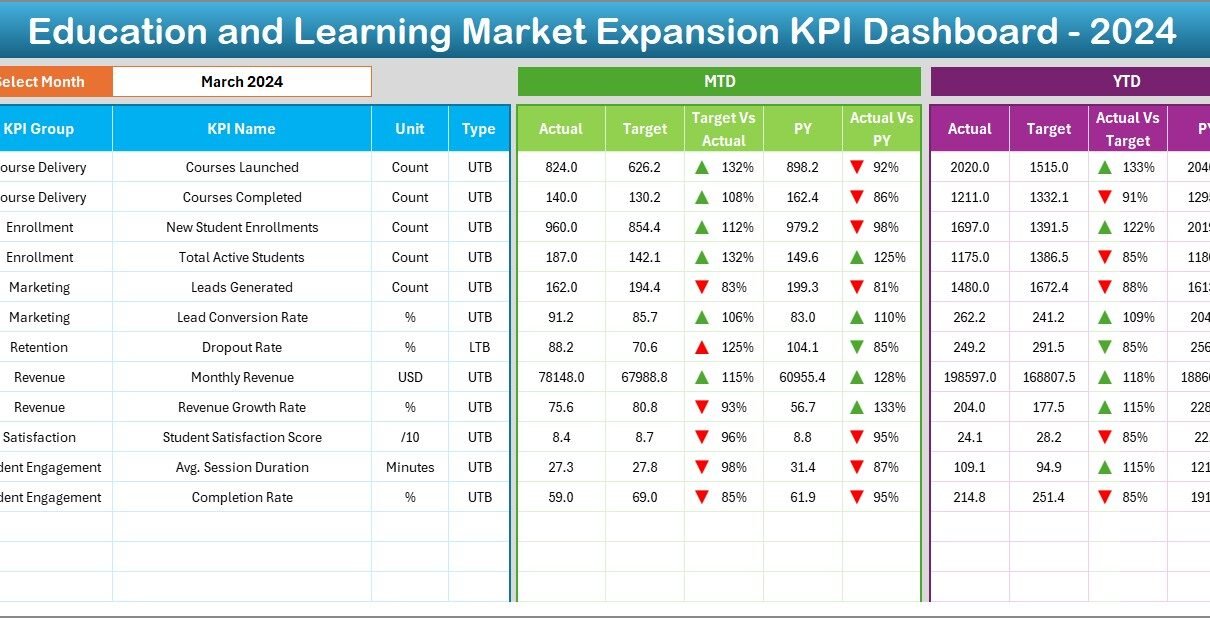
Education and Learning Market Expansion KPI Dashboard in Excel

June 7, 2025June 7, 2025 PKComments Off on Education and Learning Market Expansion KPI Dashboard in Excel
In the evolving world of education, institutions and training organizations must track performance, growth, and expansion metrics effectively. One powerful way to do this is through a KPI Dashboard built
Read More

Posts pagination

Previous 1 2
  • Learn Excel (Free Course)
    • 1. Shortcut Keys
    • 2. Fill & Flash Fill
    • 3. Find & Replace
    • 4. Sort & Filter
    • 5. Formulas & Functions
    • 6. Data Validation
    • 7. Conditional Formatting
    • 8. Basic Charts
    • 9. Advanced Charts
    • 10. Pivot Tables
    • 11. Excel Dashboards
    • 12. VBA Course
    • 13. Excel Formulas with AI
  • Templates
  • Tutorials
    • Charts and Visualization
    • VBA
    • Excel Tips and Tricks
    • Excel Dashboards
    • Power Pivot & DAX
  • Power BI
  • Template Store
    • Ready to Use Templates
  • Courses
  • Academy
    • Excel + AI Mastery: 100 Formulas
    • Excel Pivot Tables & Dashboards
  • About Us
  • Contact Us
Copyright © 2023 PK-AnExcelExpert.com - Privacy Policy