New: NextGenTemplates Academy - video courses on Excel formulas with AI and Pivot Tables & dashboards. Early-bird: 20% off with code EARLYBIRD20 - first 20 orders only. See the courses →
  • Learn Excel (Free Course)
    • 1. Shortcut Keys
    • 2. Fill & Flash Fill
    • 3. Find & Replace
    • 4. Sort & Filter
    • 5. Formulas & Functions
    • 6. Data Validation
    • 7. Conditional Formatting
    • 8. Basic Charts
    • 9. Advanced Charts
    • 10. Pivot Tables
    • 11. Excel Dashboards
    • 12. VBA Course
    • 13. Excel Formulas with AI
  • Templates
  • Tutorials
    • Charts and Visualization
    • VBA
    • Excel Tips and Tricks
    • Excel Dashboards
    • Power Pivot & DAX
  • Power BI
  • Template Store
    • Ready to Use Templates
  • Courses
  • Academy
    • Excel + AI Mastery: 100 Formulas
    • Excel Pivot Tables & Dashboards
  • About Us
  • Contact Us

PK: An Excel Expert

Transforming Data into Decisions

Tag: Excel Power BI

Dashboard Power BI

Refinery Contract KPI Dashboard in Power BI

December 28, 2025December 28, 2025 PKComments Off on Refinery Contract KPI Dashboard in Power BI
Managing refinery contracts demands accuracy, transparency, and constant performance monitoring. Refineries deal with high-value vendor contracts, strict compliance clauses, penalty conditions, service-level agreements, and long-term commitments. Therefore, decision-makers cannot rely
Read More
Dashboard Power BI

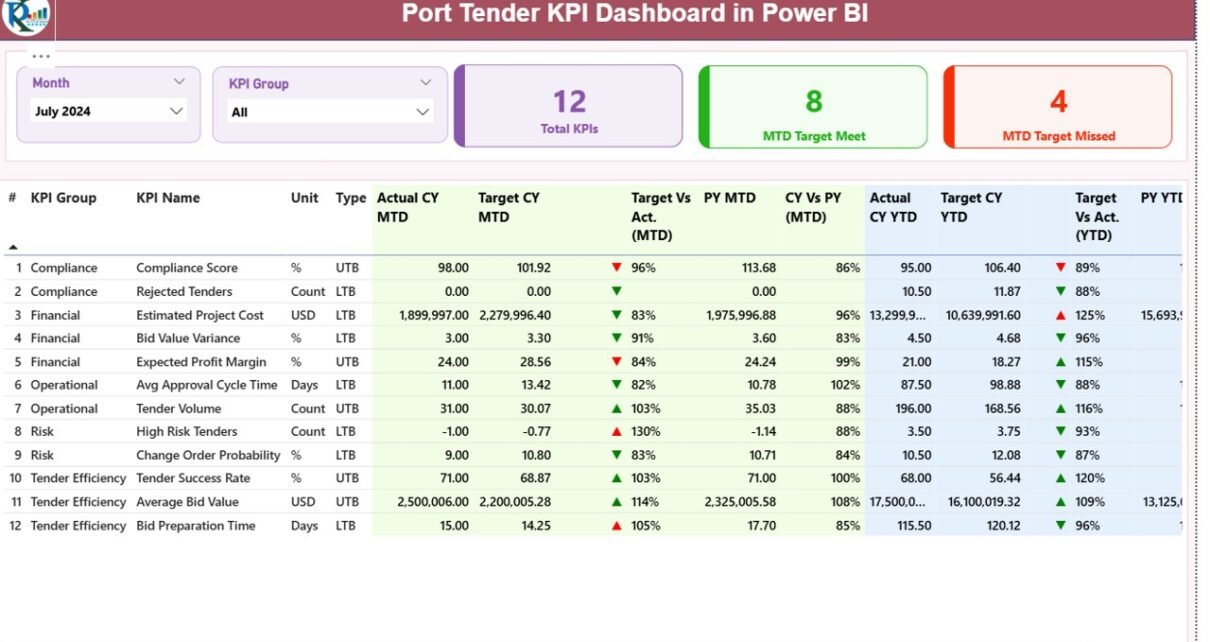
Port Tender KPI Dashboard in Power BI

December 25, 2025October 10, 2026 PKComments Off on Port Tender KPI Dashboard in Power BI
Managing port tenders involves complex processes, strict compliance, multiple stakeholders, and continuous performance monitoring. However, when organizations rely only on spreadsheets or manual tracking, they often face delays, errors, and
Read More
Dashboard Power BI

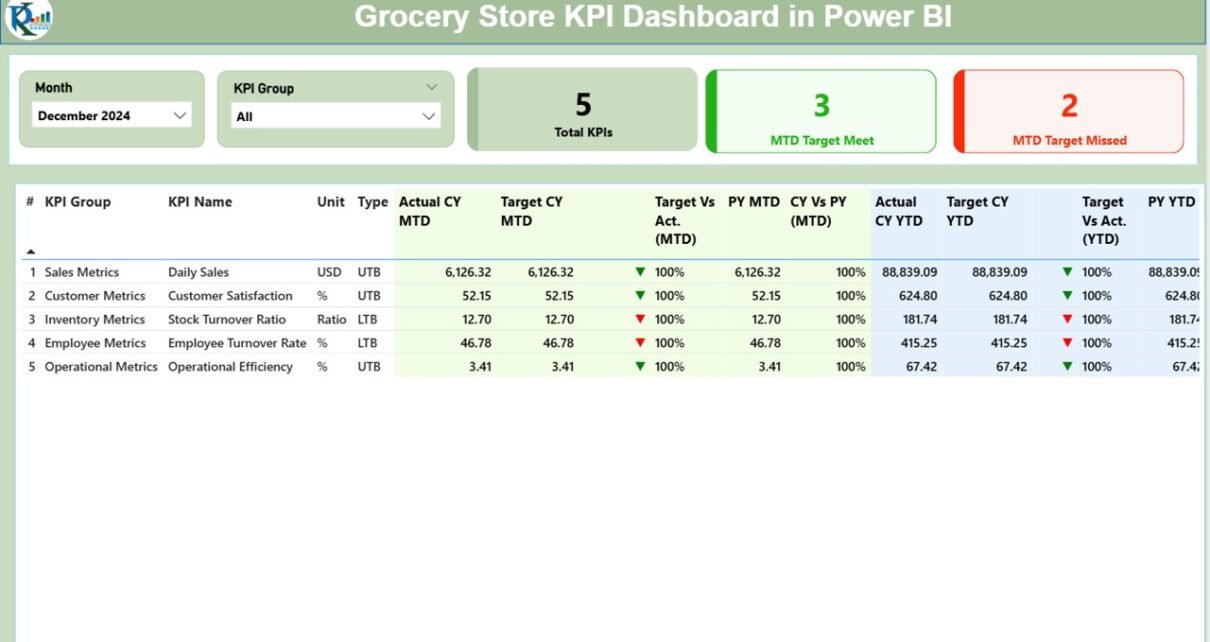
Grocery Store KPI Dashboard in Power BI

September 9, 2025September 9, 2025 PKComments Off on Grocery Store KPI Dashboard in Power BI
Running a grocery store is not just about stocking shelves and serving customers. Behind the scenes, a lot of data drives profitability, customer satisfaction, and operational efficiency. From monitoring sales
Read More
  • Learn Excel (Free Course)
    • 1. Shortcut Keys
    • 2. Fill & Flash Fill
    • 3. Find & Replace
    • 4. Sort & Filter
    • 5. Formulas & Functions
    • 6. Data Validation
    • 7. Conditional Formatting
    • 8. Basic Charts
    • 9. Advanced Charts
    • 10. Pivot Tables
    • 11. Excel Dashboards
    • 12. VBA Course
    • 13. Excel Formulas with AI
  • Templates
  • Tutorials
    • Charts and Visualization
    • VBA
    • Excel Tips and Tricks
    • Excel Dashboards
    • Power Pivot & DAX
  • Power BI
  • Template Store
    • Ready to Use Templates
  • Courses
  • Academy
    • Excel + AI Mastery: 100 Formulas
    • Excel Pivot Tables & Dashboards
  • About Us
  • Contact Us
Copyright © 2023 PK-AnExcelExpert.com - Privacy Policy