New: NextGenTemplates Academy - video courses on Excel formulas with AI and Pivot Tables & dashboards. Early-bird: 20% off with code EARLYBIRD20 - first 20 orders only. See the courses →
  • Learn Excel (Free Course)
    • 1. Shortcut Keys
    • 2. Fill & Flash Fill
    • 3. Find & Replace
    • 4. Sort & Filter
    • 5. Formulas & Functions
    • 6. Data Validation
    • 7. Conditional Formatting
    • 8. Basic Charts
    • 9. Advanced Charts
    • 10. Pivot Tables
    • 11. Excel Dashboards
    • 12. VBA Course
    • 13. Excel Formulas with AI
  • Templates
  • Tutorials
    • Charts and Visualization
    • VBA
    • Excel Tips and Tricks
    • Excel Dashboards
    • Power Pivot & DAX
  • Power BI
  • Template Store
    • Ready to Use Templates
  • Courses
  • Academy
    • Excel + AI Mastery: 100 Formulas
    • Excel Pivot Tables & Dashboards
  • About Us
  • Contact Us

PK: An Excel Expert

Transforming Data into Decisions

Tag: Excel reporting

Dashboard

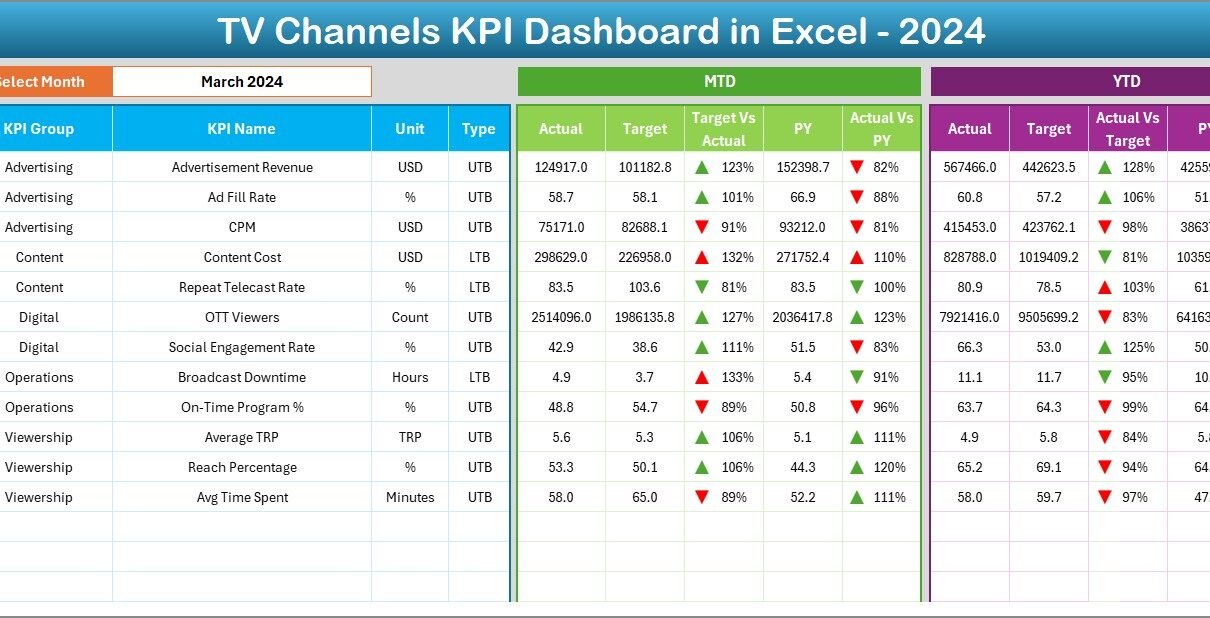
TV Channels KPI Dashboard in Excel

December 22, 2025December 22, 2025 PKComments Off on TV Channels KPI Dashboard in Excel
TV channels operate in a fast-moving and highly competitive environment. Every single day, teams monitor ratings, audience reach, advertising revenue, content performance, and operational efficiency. Therefore, tracking performance accurately becomes
Read More
Dashboard Power Pivot

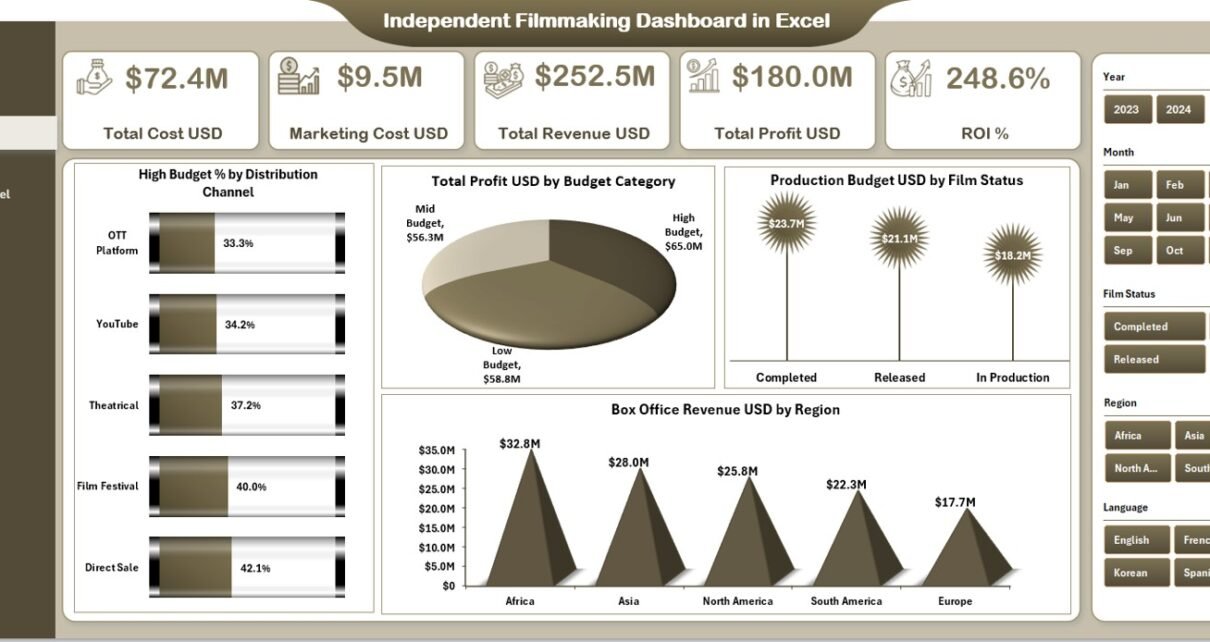
Independent Filmmaking Dashboard in Excel

December 20, 2025December 20, 2025 PKComments Off on Independent Filmmaking Dashboard in Excel
Independent filmmaking is a creative journey filled with passion, risk, and constant financial pressure. Filmmakers must manage limited budgets, control production costs, monitor marketing spend, and still aim for strong
Read More
Dashboard

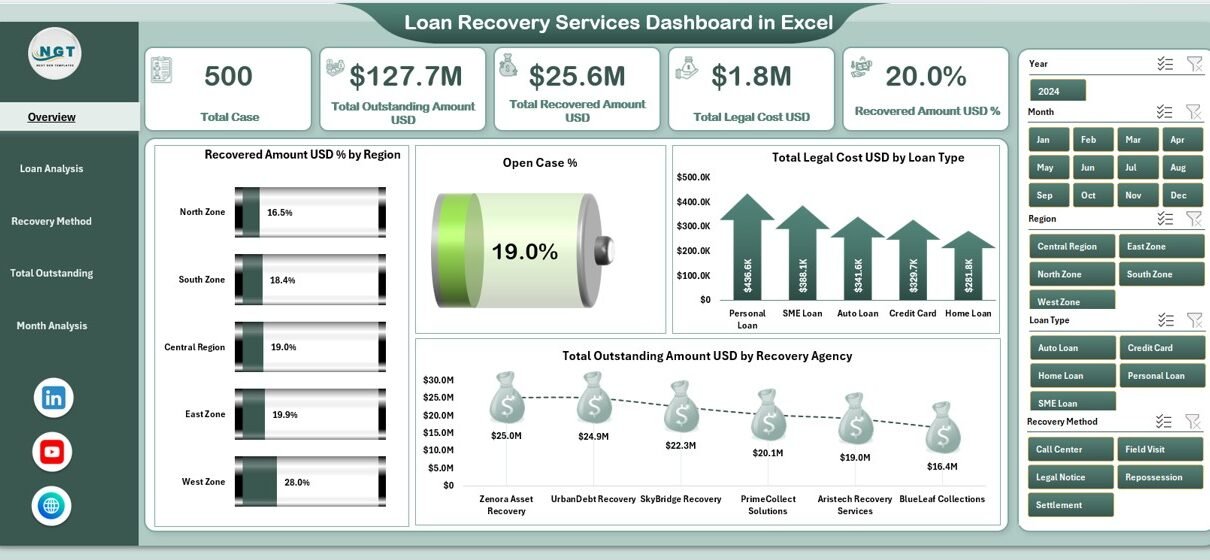
Loan Recovery Services Dashboard in Excel

December 16, 2025December 18, 2025 PKComments Off on Loan Recovery Services Dashboard in Excel
Managing loan recovery without proper visibility often creates delays, higher costs, and lower recovery rates. However, when financial institutions rely only on scattered spreadsheets or manual reports, decision-making becomes slow
Read More
Dashboard

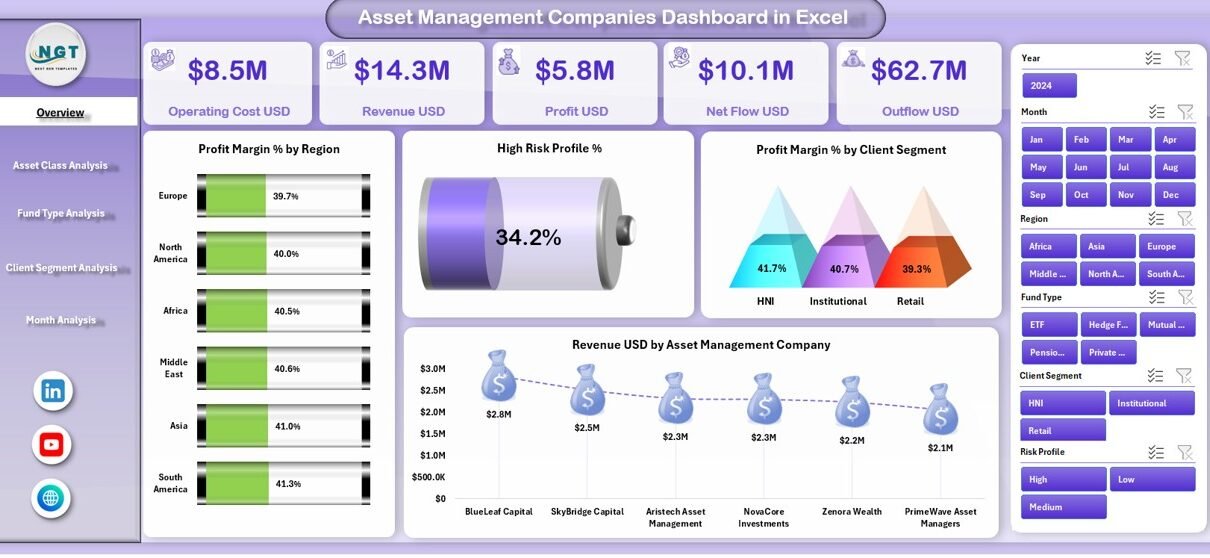
Asset Management Companies Dashboard in Excel

December 15, 2025December 15, 2025 PKComments Off on Asset Management Companies Dashboard in Excel
Managing investments across asset classes, funds, client segments, and time periods demands accuracy, clarity, and speed. However, many asset management companies still rely on scattered spreadsheets, static reports, and manual
Read More
Dashboard

Museums & Cultural Centres Dashboard in Excel

December 13, 2025December 13, 2025 PKComments Off on Museums & Cultural Centres Dashboard in Excel
Managing museums and cultural centres requires a perfect balance between visitor experience, financial sustainability, and operational efficiency. However, when data remains scattered across spreadsheets, reports, and manual logs, decision-making becomes
Read More
Dashboard

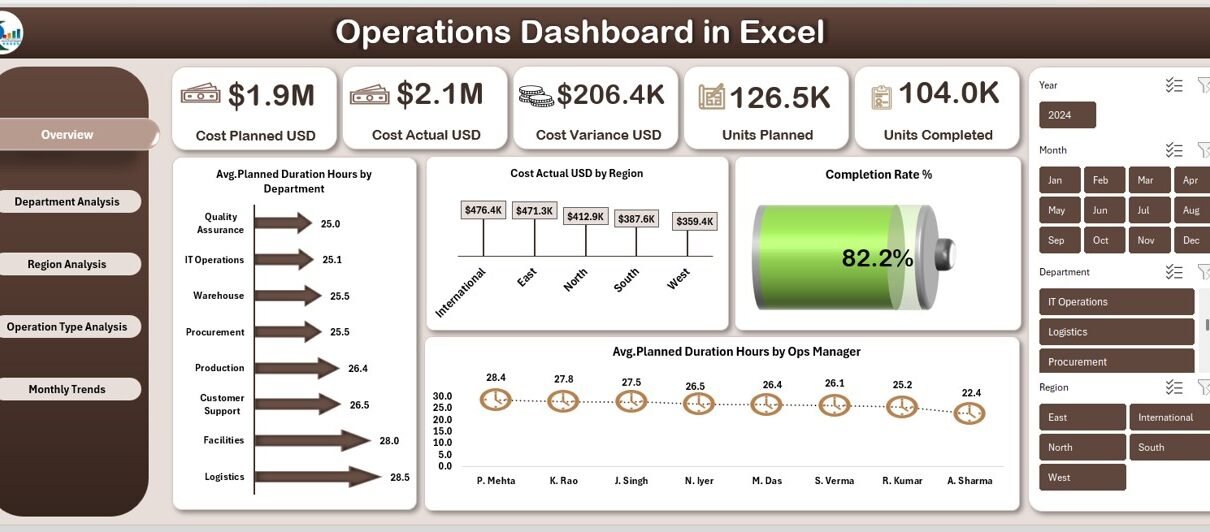
Operations Dashboard in Excel

December 7, 2025December 7, 2025 PKComments Off on Operations Dashboard in Excel
In today’s fast-paced business environment, organizations handle multiple operations across departments, regions, and managers. However, without a structured monitoring system, operational performance often becomes unclear. Numbers remain scattered across files,
Read More
Dashboard

Research & Development Institutes KPI Dashboard in Excel

November 29, 2025November 29, 2025 PKComments Off on Research & Development Institutes KPI Dashboard in Excel
Research and Development (R&D) plays a key role in innovation, scientific growth, and industry advancement. However, research institutes often struggle to measure their performance clearly. Teams manage several projects, experiments,
Read More
Dashboard

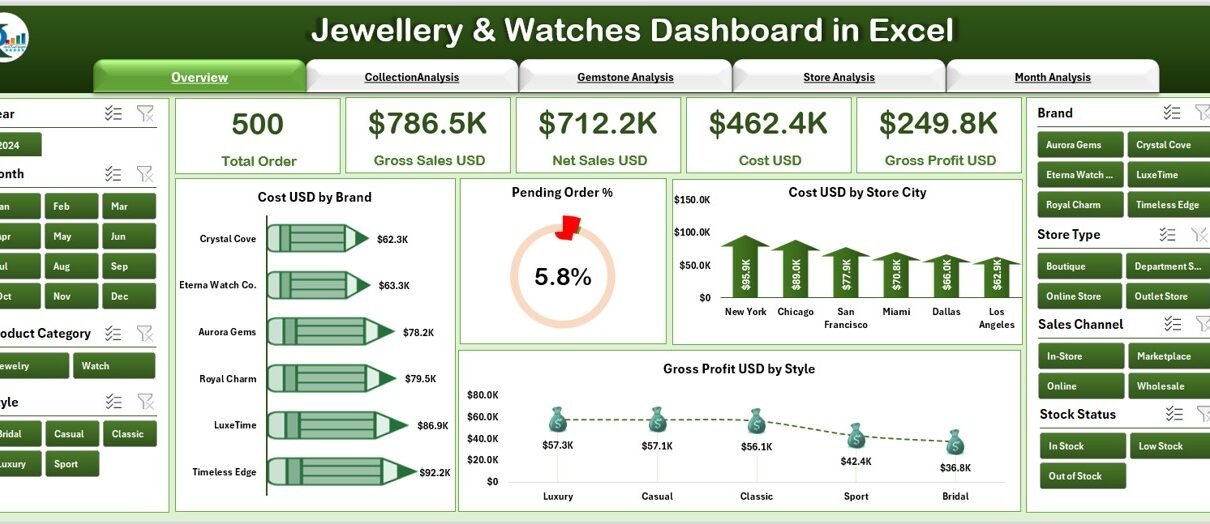
Jewellery & Watches Dashboard in Excel

November 18, 2025November 18, 2025 PKComments Off on Jewellery & Watches Dashboard in Excel
The jewellery and watches industry grows every day, and retailers must stay ahead by understanding their sales, collections, gemstones, store performance, and monthly trends. Many businesses still rely on scattered
Read More
Dashboard

Architecture KPI Scorecard in Excel

November 7, 2025November 7, 2025 PKComments Off on Architecture KPI Scorecard in Excel
In the world of architecture, data-driven decision-making plays a vital role in ensuring successful project outcomes. From design efficiency to cost control and client satisfaction, every architectural firm needs accurate
Read More
Dashboard

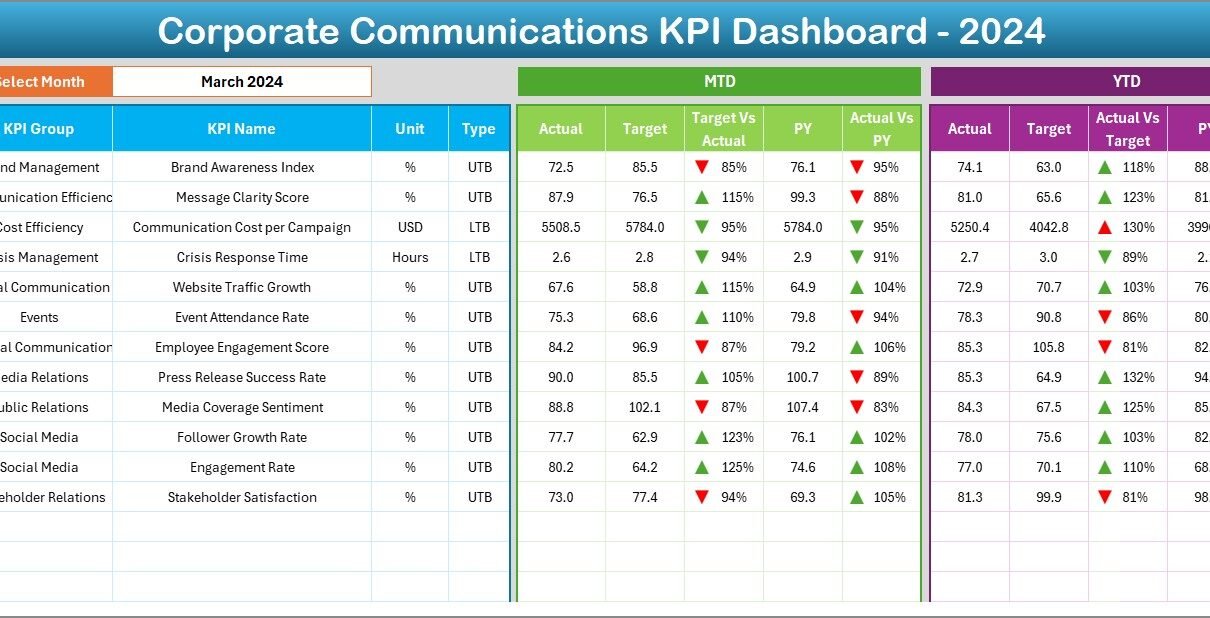
Corporate Communications KPI Dashboard in Excel

November 5, 2025November 5, 2025 PKComments Off on Corporate Communications KPI Dashboard in Excel
In today’s dynamic business world, effective communication is the foundation of organizational success. Whether it’s internal announcements, public relations campaigns, or stakeholder engagement, every message shapes the company’s brand and
Read More

Posts pagination

Previous 1 … 6 7 8 9 Next
  • Learn Excel (Free Course)
    • 1. Shortcut Keys
    • 2. Fill & Flash Fill
    • 3. Find & Replace
    • 4. Sort & Filter
    • 5. Formulas & Functions
    • 6. Data Validation
    • 7. Conditional Formatting
    • 8. Basic Charts
    • 9. Advanced Charts
    • 10. Pivot Tables
    • 11. Excel Dashboards
    • 12. VBA Course
    • 13. Excel Formulas with AI
  • Templates
  • Tutorials
    • Charts and Visualization
    • VBA
    • Excel Tips and Tricks
    • Excel Dashboards
    • Power Pivot & DAX
  • Power BI
  • Template Store
    • Ready to Use Templates
  • Courses
  • Academy
    • Excel + AI Mastery: 100 Formulas
    • Excel Pivot Tables & Dashboards
  • About Us
  • Contact Us
Copyright © 2023 PK-AnExcelExpert.com - Privacy Policy